Toolbit.ai
Toolbit.ai

Draxlr

Build powerful dashboards and set alerts on SQL data

Monthly Visits: 263.5K
API Available
Visit Website
Draxlr

What is Draxlr?

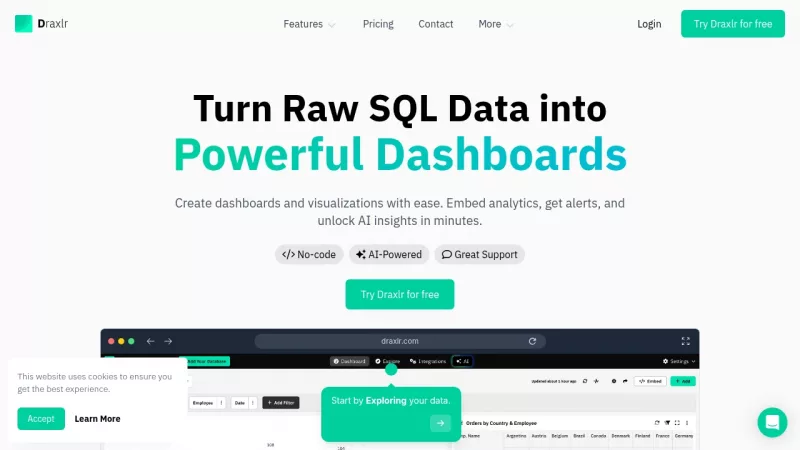
Draxlr lets you create dashboards and visualizations from your SQL databases without any coding. You can embed these analytics into your applications and set up alerts for data changes. This helps non-technical users monitor data and make informed business decisions quickly.

Key Features of Draxlr

  1. 1

    Query Builder

    Use AI to build queries and get answers from SQL data.

  2. 2

    Dashboard Embedding

    Embed beautiful dashboards into applications with customer context.

  3. 3

    Alerts

    Set alerts for data changes and get notified via Email or Slack.

  4. 4

    No-code

    Create dashboards without any coding knowledge easily.

  5. 5

    AI Insights

    Unlock AI-powered insights from your data in minutes.

Draxlr AI Tool Use Cases

  • 🔍
    Research and analyze business data
  • 📊
    Create customer analytics dashboards
  • 🚨
    Set up alerts for critical business events
  • 📈
    Monitor KPIs and performance metrics

Pros & Cons of Draxlr

Pros (4)

  • No-code interface for easy dashboard creation
  • AI-powered query building and insights
  • Wide compatibility with popular SQL databases
  • Excellent customer support and fast feature updates

Cons (2)

  • Only supports SQL databases, limiting other data sources
  • Requires database connectivity setup which may need technical knowledge

More Info About Draxlr

Who is using draxlr?

This tool is best for:

  1. Business executives
  2. Data analysts
  3. Product managers
  4. CTOs

Draxlr's Tags

Explore more niche AI tool websites by clicking on a tag* (works only if it has enough tools).

#NoCodeAnalytics #BusinessIntelligence#AIDataInsights#SQLDashboards#DataAlerts

Integrate Draxlr With These Apps

Draxlr can be integrated with these apps and services:

  • Slack
  • Email

Website Analytics of Draxlr

Draxlr Website Traffic & SEO Analysis:

Recent data shows that Draxlr has 263.5K monthly visits (27.0% increase from the previous month), 53.0% bounce rate, and average 2.49 pages per visit.
Traffic is primarily driven by 6 different sources, with users from 5 countries worldwide, led by United States contributing 29% of total traffic. SEO performance is shown by 5 tracked keywords, with "bar graph maker" being the top-performing keyword with 13.8K monthly searches. See below for more info.

Monthly Visits

263.5K

(+27.0%)

Pages per Visit

2.49

Bounce Rate

53.0%

Average Time on Site

1m 17s

Traffic Trend(Jul 2025 - Sep 2025)

Loading chart...

Top Keywords

SEO KeywordVolumeCPC
bar graph maker
13.8K$2.14
bar chart maker
6.4K$1.94
pie chart maker
40.1K$1.64
line graph
66.1K$4.51
line graph maker
17.0K$1.89

Traffic Sources Distribution

Traffic Share by Source

Loading chart...

Source Breakdown Details

SourceTraffic Share
Direct
30%
Search
61%
Social
2%
Referrals
6%
Paid Referrals
1%

Global Traffic Distribution

Traffic Share by Country

Loading chart...

Geographic Breakdown Details of top 5 countries

Country NameTraffic Share
United States29%
India16%
United Kingdom6%
Philippines5%
Australia4%
Analytics data is estimated (from third-party analytics providers) and for reference only.

🚀 Draxlr Launch Badge

Promote your Toolbit Launch by using the badge on your website. It can be inserted on your home page or footer easily.

How to use: Simply copy and paste the embed code into your homepage or footer HTML to display it instantly and build community support.

ToolBit badge

Reviews for Draxlr