Toolbit.ai
Toolbit.ai

FinancialInsights.ai

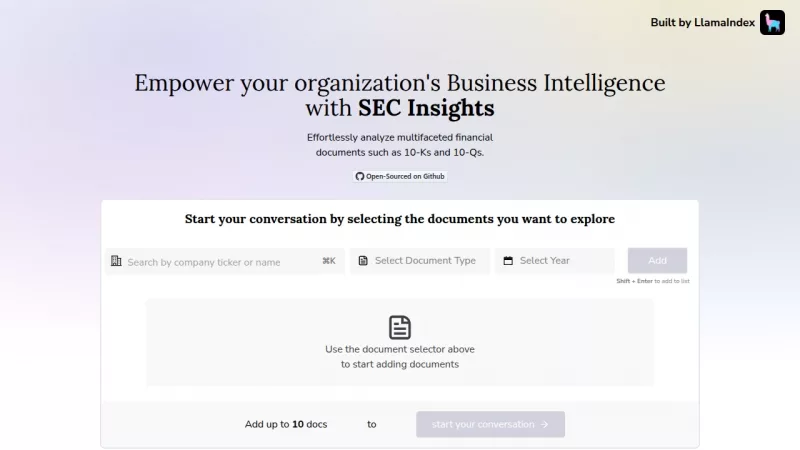
Transform financial filings into actionable company insights

Monthly Visits: 71
Visit Website
FinancialInsights.ai

What is FinancialInsights.ai?

FinancialInsights.ai uses AI to analyze complex SEC filings like 10-K and 10-Q reports, helping users spot financial trends and risks. 'nIt provides investors and analysts with deep company comparisons and risk assessments to support data-driven decisions.

Key Features of FinancialInsights.ai

  1. 1

    SEC Filing Analysis

    Automates extraction of key data from 10-K/10-Q reports

  2. 2

    Company Comparisons

    Benchmarks financial performance against industry peers

  3. 3

    Risk Detection

    Identifies hidden risks in financial disclosures

FinancialInsights.ai Tool Use Cases

  • 🔍
    Analyze SEC filings for investment research
  • 📊
    Compare company financial performance
  • ⚠️
    Identify hidden risks in disclosures
  • 📈
    Track financial trends across industries

Pros & Cons of FinancialInsights.ai

Pros (4)

  • Specialized analysis of SEC filings
  • AI-powered risk detection capabilities
  • Covers 10,000+ company profiles
  • Focuses on actionable financial metrics

Cons (1)

  • Niche focus limited to SEC filings analysis

More Info About FinancialInsights.ai

Who is using financialinsights.ai?

This tool is best for:

  1. Financial analysts
  2. Investment researchers
  3. Corporate strategists

FinancialInsights.ai's Tags

Explore more niche AI tool websites by clicking on a tag* (works only if it has enough tools).

#FinancialAnalytics #RiskAssessment#InvestmentResearch#SECFilings#CompanyAnalysis

Website Analytics of FinancialInsights.ai

FinancialInsights.ai Website Traffic & SEO Analysis:

Recent data shows that FinancialInsights.ai has 71 monthly visits (Infinity% increase from the previous month), 41.0% bounce rate, and average 1.03 pages per visit.
Traffic is primarily driven by 6 different sources, with users from 1 countries worldwide, led by United States contributing 100% of total traffic. SEO performance is shown by 2 tracked keywords, with "analyze alphabet inc.'s recent performance" being the top-performing keyword with 230 monthly searches. See below for more info.

Monthly Visits

71

(+Infinity%)

Pages per Visit

1.03

Bounce Rate

41.0%

Traffic Trend(Apr 2025 - Sep 2025)

Loading chart...

Top Keywords

SEO KeywordVolumeCPC
analyze alphabet inc.'s recent performance
230-
ibm revenue breakdown
90-

Traffic Sources Distribution

Traffic Share by Source

Loading chart...

Source Breakdown Details

SourceTraffic Share
Direct
42%
Search
33%
Social
10%
Referrals
13%
Paid Referrals
2%

Global Traffic Distribution

Traffic Share by Country

Loading chart...

Geographic Breakdown Details of top 1 country

Country NameTraffic Share
United States100%
Analytics data is estimated (from third-party analytics providers) and for reference only.

🚀 FinancialInsights.ai Launch Badge

Promote your Toolbit Launch by using the badge on your website. It can be inserted on your home page or footer easily.

How to use: Simply copy and paste the embed code into your homepage or footer HTML to display it instantly and build community support.

ToolBit badge

Reviews for FinancialInsights.ai