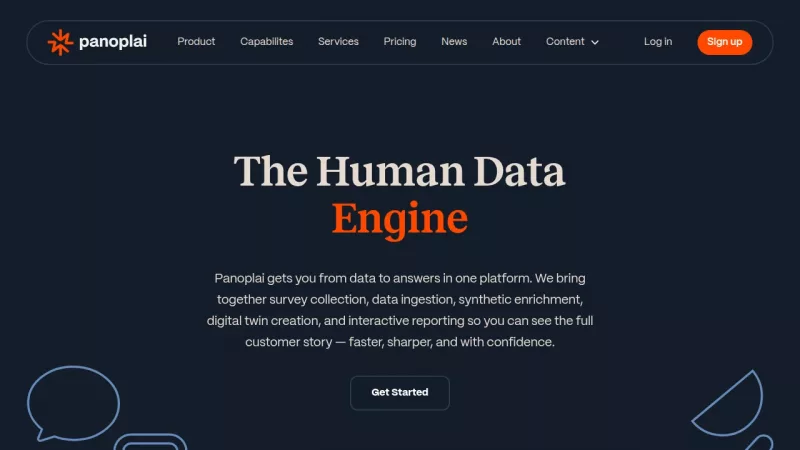
Accelerate enterprise research with AI-powered digital twins
no questions found.
Promote your Toolbit Launch by using the badge on your website. It can be inserted on your home page or footer easily.
How to use: Simply copy and paste the embed code into your homepage or footer HTML to display it instantly and build community support.

Traffic, engagement & audience insights
7.3K
Monthly Visits
1.91
Pages per Visit
41.4%
Bounce Rate
19s
Avg. Time on Site
| SEO Keyword | Volume | CPC |
|---|---|---|
1panoplai | 770 | - |
2panoplai rewards | 450 | - |
3chipotlai | 7.3K | - |
4sri muppidi | 1.1K | - |
5pano ai | 1.1K | $3.47 |
| Country | Monthly Visits | Share |
|---|---|---|
1 | 3.8K | 51% |
2 | 1.3K | 18% |
3 | 1.0K | 14% |
4 | 646 | 9% |
5 | 330 | 5% |
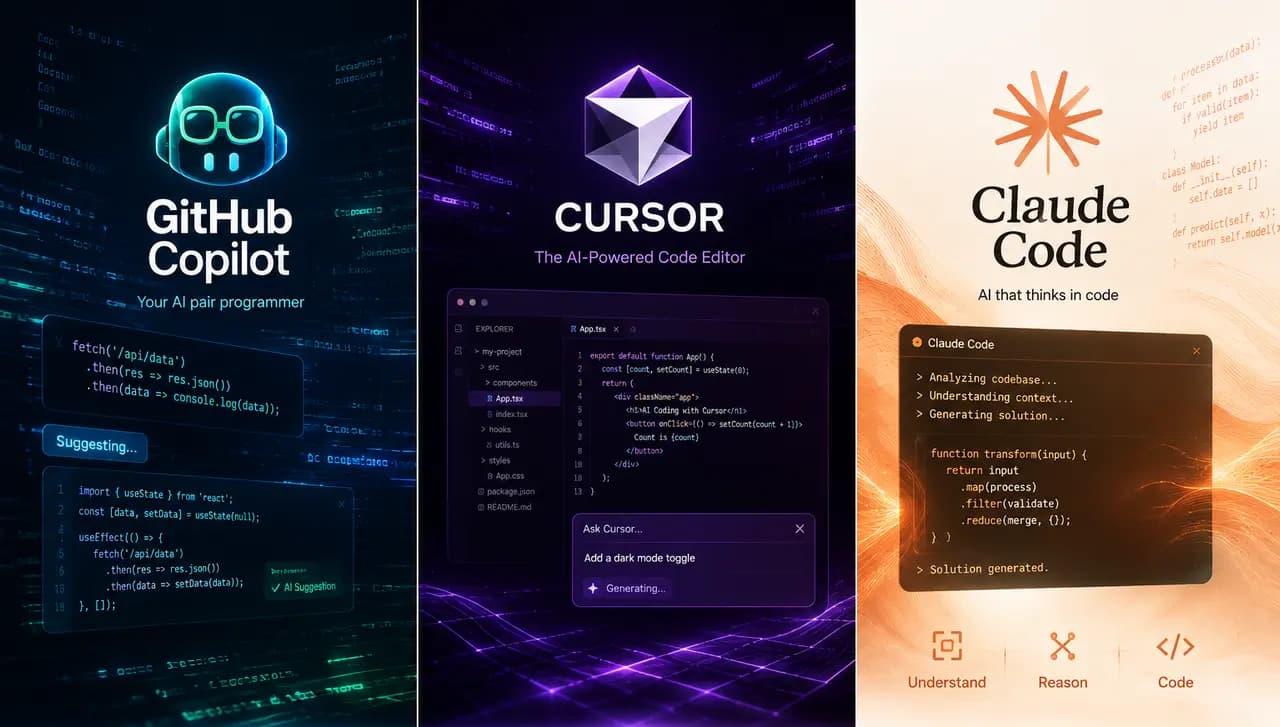
GitHub Copilot, Cursor, and Claude Code have changed AI coding in 2026. Compare features, pricing, and real-world performance to choose the best AI coding assistant for your development workflow.