Toolbit.ai
Toolbit.ai
Sales Call AnalysisSales CoachingPlaybook Management

SilkChart

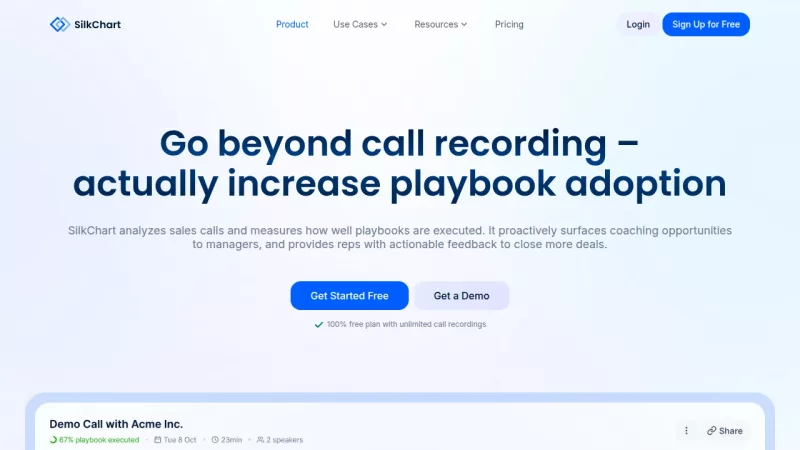
Analyze sales calls to boost playbook adoption and close more deals

Monthly Visits: 1.6K
Free
Free Version
Visit Website
SilkChart

What is SilkChart?

SilkChart helps sales teams by analyzing their calls to see how well they're following playbooks. It provides actionable feedback to reps and surfaces coaching opportunities for managers. This leads to improved performance and more deals closed, all without extra work from the team.

Key Features of SilkChart

  1. 1

    Playbook Tracking

    Measure how well reps follow sales playbooks in calls

  2. 2

    AI Coaching

    Provide immediate, specific feedback to reps after each call

  3. 3

    Deal Health

    Surface early signals of deal risks based on call analysis

  4. 4

    Team Analytics

    Automatically highlight calls and reps needing attention

  5. 5

    Integrations

    Sync with calendars and deliver insights to email and Slack

SilkChart AI Tool Use Cases

  • 🔍
    Track playbook adoption for sales reps
  • ✍️
    Provide actionable feedback on calls
  • 📊
    Analyze team performance and risks
  • 🤖
    Get AI-driven coaching for reps

Pros & Cons of SilkChart

Pros (4)

  • 100% free plan with unlimited call recordings
  • Proactively surfaces coaching opportunities for managers
  • Provides specific, actionable feedback to reps
  • Seamless integrations with calendars and tools

Cons (2)

  • Built specifically for B2B SaaS sales teams, limiting use in other industries
  • Requires call recordings, which may not be feasible for all teams

More Info About SilkChart

Who is using silkchart?

This tool is best for:

  1. B2B SaaS sales teams
  2. Sales managers
  3. Sales representatives

SilkChart's Tags

Explore more niche AI tool websites by clicking on a tag* (works only if it has enough tools).

#SalesCoaching #B2BSaaS#SilkChart#SalesAnalytics#PlaybookAdoption

Integrate SilkChart With These Apps

SilkChart can be integrated with these apps and services:

  • Calendars
  • Email
  • Slack
  • CRM

Website Analytics of SilkChart

SilkChart Website Traffic & SEO Analysis:

Recent data shows that SilkChart has 1.6K monthly visits (Infinity% increase from the previous month), 39.0% bounce rate, and average 1.67 pages per visit.
Traffic is primarily driven by 6 different sources, with users from 1 countries worldwide, led by United States contributing 100% of total traffic. SEO performance is shown by 5 tracked keywords, with "sudden jump in software costs" being the top-performing keyword with 50 monthly searches. See below for more info.

Monthly Visits

1.6K

(+Infinity%)

Pages per Visit

1.67

Bounce Rate

39.0%

Average Time on Site

32s

Traffic Trend(Jul 2025 - Sep 2025)

Loading chart...

Top Keywords

SEO KeywordVolumeCPC
sudden jump in software costs
50-
gong pricing
2.2K$27.32
gong alternatives
680-
gong competitors
660$51.89
gong io competitors
280-

Traffic Sources Distribution

Traffic Share by Source

Loading chart...

Source Breakdown Details

SourceTraffic Share
Direct
42%
Search
33%
Social
10%
Referrals
13%
Paid Referrals
2%

Global Traffic Distribution

Traffic Share by Country

Loading chart...

Geographic Breakdown Details of top 1 country

Country NameTraffic Share
United States100%
Analytics data is estimated (from third-party analytics providers) and for reference only.

🚀 SilkChart Launch Badge

Promote your Toolbit Launch by using the badge on your website. It can be inserted on your home page or footer easily.

How to use: Simply copy and paste the embed code into your homepage or footer HTML to display it instantly and build community support.

ToolBit badge

Reviews for SilkChart