Toolbit.ai
Toolbit.ai
Reading TrackerBook RecommendationReading Community Platform

The StoryGraph

Discover perfect books based on your mood and reading habits

Monthly Visits: 3.7M
Freemium
Free Version
Visit Website
The StoryGraph

What is The StoryGraph?

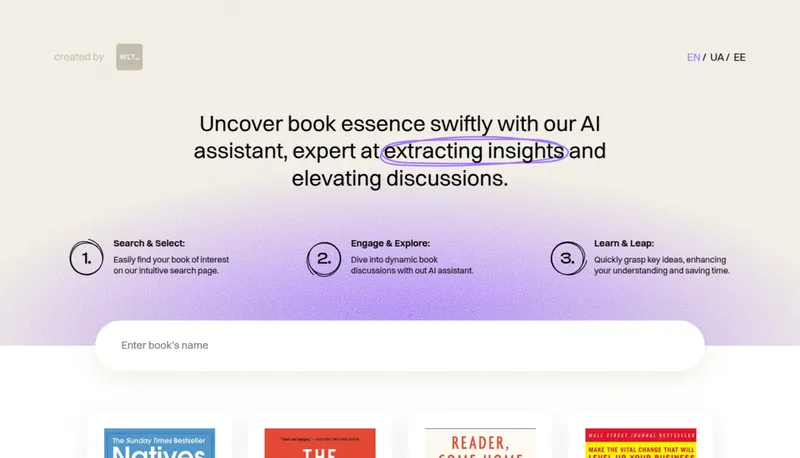
The StoryGraph helps book lovers track their reading patterns and find new books tailored to their current mood. It uses AI to suggest books based on your preferences and offers detailed content warnings. An ethical alternative to Goodreads with no Amazon connection.

Key Features of The StoryGraph

  1. 1

    Mood Discovery

    Filter books by mood combinations like 'adventurous & funny'

  2. 2

    AI Recommendations

    Machine learning suggests books matching your taste

  3. 3

    Content Warnings

    Avoid triggering content with upfront disclosures

  4. 4

    Reading Challenges

    Join global book goals or create personal targets

  5. 5

    Half Stars

    Rate books precisely with quarter/half-star increments

The StoryGraph AI Tool Use Cases

  • 📚
    Track reading progress with analytics
  • 🤖
    Get AI-powered book suggestions
  • ⚠️
    Avoid unwanted content with filters
  • 👥
    Share spoiler-free reactions with friends
  • 🏆
    Join global reading challenges

FAQs from The StoryGraph

Can I import my Goodreads data?

Yes, The StoryGraph imports all Goodreads shelves including custom shelves (converted to tags)

Is there a mobile app?

Yes, available on iOS App Store and Android Play Store, with direct download option for unsupported regions

What's included in the Plus plan?

Advanced stats, custom recommendation filters, and priority feature requests

Pros & Cons of The StoryGraph

Pros (4)

  • Mood-based filtering system for precise book discovery
  • Ethical Amazon-free platform design
  • Detailed content warnings for sensitive readers
  • Granular rating system with half/quarter stars

Cons (3)

  • Limited third-party integrations compared to competitors
  • Advanced features require Plus subscription
  • Book club features still in development

The StoryGraph's Pricing Plans

Plus

monthly
$5

Features

  • Advanced reading stats
  • Custom recommendation filters
  • Priority feature requests

Plus

yearly
$50

Features

  • All Plus monthly features
  • 2 months free compared to monthly plan
For the latest pricing info, please visit the official website

More Info About The StoryGraph

Who is using the storygraph?

This tool is best for:

  1. Avid readers tracking multiple books
  2. Book club participants
  3. Readers avoiding triggering content
  4. Amazon boycott supporters

The StoryGraph's Tags

Explore more niche AI tool websites by clicking on a tag* (works only if it has enough tools).

#SpoilerFreeBookClub#EthicalBookPlatform#MoodBasedReading

Platforms & Device Support

Use The StoryGraph on your favorite device - available across multiple platforms for flexibility.

Mobile App

iPhone
Get App
Android Phones
Get App

The StoryGraph Social Media

Visit The StoryGraph on social media to stay updated with the latest news and features.

Website Analytics of The StoryGraph

The StoryGraph Website Traffic & SEO Analysis:

Recent data shows that The StoryGraph has 3.7M monthly visits (16.2% increase from the previous month), 32.0% bounce rate, and average 6.88 pages per visit.
Traffic is primarily driven by 6 different sources, with users from 5 countries worldwide, led by United States contributing 56% of total traffic. SEO performance is shown by 5 tracked keywords, with "storygraph" being the top-performing keyword with 202.9K monthly searches. See below for more info.

Monthly Visits

3.7M

(+16.2%)

Pages per Visit

6.88

Bounce Rate

32.0%

Average Time on Site

4m 57s

Traffic Trend(May 2025 - Jul 2025)

Loading chart...

Top Keywords

SEO KeywordVolumeCPC
storygraph
202.9K$0.19
story graph
16.0K$0.30
the storygraph
12.3K-
thestorygraph
3.5K-
the story graph
2.4K-

Traffic Sources Distribution

Traffic Share by Source

Loading chart...

Source Breakdown Details

SourceTraffic Share
Direct
68%
Search
28%
Social
1%
Referrals
3%

Global Traffic Distribution

Traffic Share by Country

Loading chart...

Geographic Breakdown Details of top 5 countries

Country NameTraffic Share
United States56%
United Kingdom8%
Canada5%
Netherlands5%
Australia4%
Analytics data is estimated (from third-party analytics providers) and for reference only.

🚀 The StoryGraph Launch Badge

Promote your Toolbit Launch by using the badge on your website. It can be inserted on your home page or footer easily.

How to use: Simply copy and paste the embed code into your homepage or footer HTML to display it instantly and build community support.

ToolBit badge

Reviews for The StoryGraph