AI Graph Maker
Transform raw data into interactive visualizations with AI-powered charts

Target Audience
- Data analysts
- Project managers
- Students/Researchers
- Business professionals
Hashtags
Overview
Turn spreadsheets and numbers into professional charts without design skills. Our AI analyzes your data to automatically create pie charts, bar graphs, and 8+ other visualization types. Customize colors and styles in seconds, then export directly to reports or presentations. Perfect for teams needing to communicate data insights quickly.
Key Features
AI Automation
Generates charts from data inputs in <10 seconds
Multi-format Export
Download as PNG, SVG, or Mermaid files
Chart Diversity
10+ types including Gantt charts & ER diagrams
Visual Customization
Edit colors, labels, and fonts in real-time
Cross-Platform
Responsive design works on all devices
Use Cases
Create market analysis reports
Visualize project timelines
Present academic research data
Track business metrics
Brainstorm ideas with mind maps
Pros & Cons
Pros
- No design skills required
- Supports niche charts like ER diagrams
- Real-time editing after generation
- Mobile-friendly interface
Cons
- Limited advanced analytics capabilities
- Free version restrictions unclear
Frequently Asked Questions
What file formats can I upload?
You can input data manually or upload TXT and Excel files
Can I edit charts after generation?
Yes, customize colors, labels, fonts, and data content in real-time
How do I export my charts?
Download as PNG, SVG, or Mermaid format via the download button
Reviews for AI Graph Maker
Alternatives of AI Graph Maker
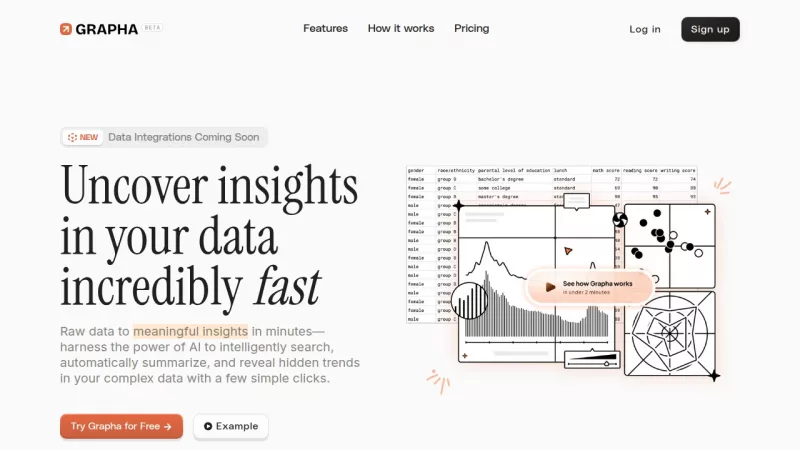
Automate data analysis and generate visualizations in seconds
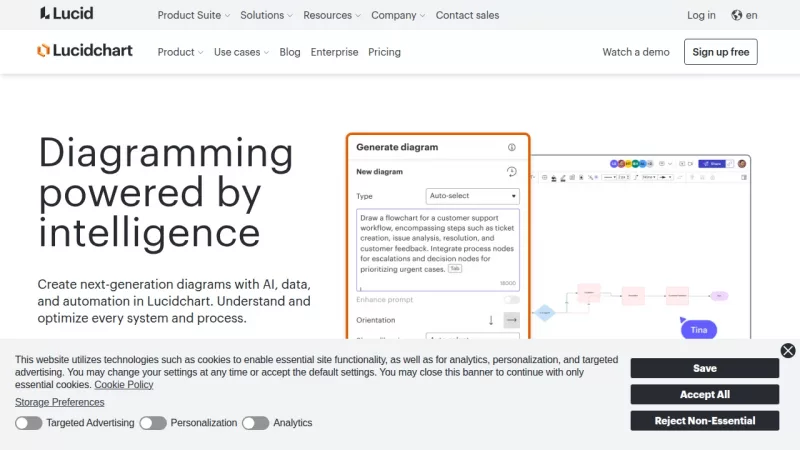
Create flowcharts and synthetic datasets through AI-powered automation