Toolbit.ai
Toolbit.ai

ChartPixel

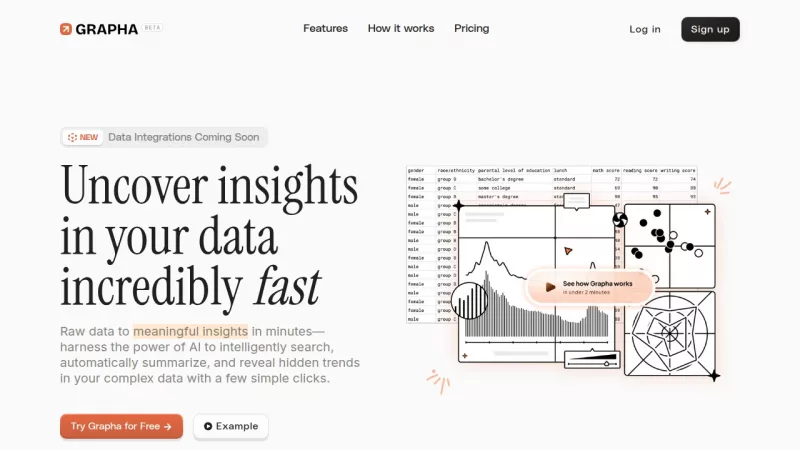
Transform raw data into visual insights in seconds

Monthly Visits: 18.1K
Visit Website
ChartPixel

What is ChartPixel?

ChartPixel simplifies data analysis for everyone by automatically cleaning data and generating interactive charts with AI explanations. No coding required - just upload spreadsheets to get instant visualizations, statistical insights, and presentation-ready slides. It's designed to help both beginners and professionals make faster data-driven decisions without Excel frustrations.

Key Features of ChartPixel

  1. 1

    Auto-charts

    Generate 20+ chart types with AI explanations in 30 seconds

  2. 2

    Data cleaning

    Automatically fix missing values and format messy datasets

  3. 3

    AI Insights

    Get plain-English explanations of trends backed by statistics

  4. 4

    One-click slides

    Export charts directly to PowerPoint for presentations

  5. 5

    Sentiment analysis

    Extract emotions from text comments in datasets

ChartPixel AI Tool Use Cases

  • 📊
    Create investor-ready business reports
  • 🎓
    Analyze academic research data
  • ✈️
    Track airline customer satisfaction
  • 📈
    Forecast stock market trends
  • 🏆
    Compare sports team performance

FAQs from ChartPixel

How does ChartPixel handle data privacy?

Doesn't train AI models on your data or send raw data to external LLMs

Can students use this tool?

Yes - designed as educational tool for beginners without coding skills

What file formats does it support?

Accepts spreadsheets and webpage tables (specific formats not mentioned)

Pros & Cons of ChartPixel

Pros (4)

  • Eliminates manual data cleaning work
  • Explains statistics in non-technical language
  • Maintains data privacy (no LLM training on your data)
  • Suitable for beginners and experts alike

Cons (2)

  • No mobile app version available
  • Limited customization for advanced data scientists

More Info About ChartPixel

Who is using chartpixel?

This tool is best for:

  1. Business owners
  2. Academic researchers
  3. Journalists
  4. Students

ChartPixel's Tags

Explore more niche AI tool websites by clicking on a tag* (works only if it has enough tools).

#NoCodeAnalytics #DataStorytelling#AICustomerInsights

Website Analytics of ChartPixel

ChartPixel Website Traffic & SEO Analysis:

Recent data shows that ChartPixel has 18.1K monthly visits (53.5% increase from the previous month), 44.0% bounce rate, and average 1.59 pages per visit.
Traffic is primarily driven by 6 different sources, with users from 5 countries worldwide, led by Malaysia contributing 28% of total traffic. SEO performance is shown by 5 tracked keywords, with "chartpixel" being the top-performing keyword with 550 monthly searches. See below for more info.

Monthly Visits

18.1K

(+53.5%)

Pages per Visit

1.59

Bounce Rate

44.0%

Average Time on Site

27s

Traffic Trend(May 2025 - Jul 2025)

Loading chart...

Top Keywords

SEO KeywordVolumeCPC
chartpixel
550-
free chart screenshot analysis
260-
ai tools for research acadmic graphs and charts
210-
ai chart analysis
1.7K$7.11
which ai give signal with stock chart screen shot
140-

Traffic Sources Distribution

Traffic Share by Source

Loading chart...

Source Breakdown Details

SourceTraffic Share
Direct
28%
Search
32%
Social
5%
Referrals
34%
Paid Referrals
1%

Global Traffic Distribution

Traffic Share by Country

Loading chart...

Geographic Breakdown Details of top 5 countries

Country NameTraffic Share
Malaysia28%
India23%
United States13%
Vietnam7%
Pakistan4%
Analytics data is estimated (from third-party analytics providers) and for reference only.

🚀 ChartPixel Launch Badge

Promote your Toolbit Launch by using the badge on your website. It can be inserted on your home page or footer easily.

How to use: Simply copy and paste the embed code into your homepage or footer HTML to display it instantly and build community support.

ToolBit badge

Reviews for ChartPixel