Toolbit.ai
Toolbit.ai

vizGPT

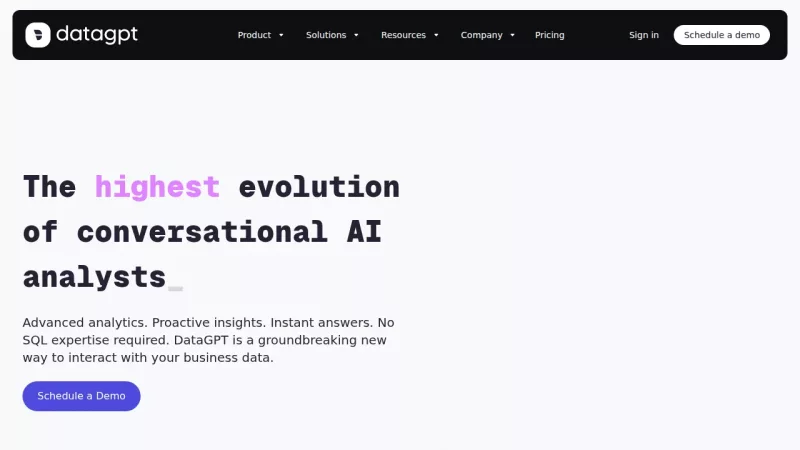
Transform raw data into visual insights through conversational AI

Monthly Visits: 24.4K
Free Version
Visit Website
vizGPT

What is vizGPT?

Turn complex data into charts using plain English conversations instead of coding. Combines drag-and-drop simplicity with AI-powered analysis for both technical and non-technical users. Maintains conversation context to build coherent data stories over multiple interactions.

Key Features of vizGPT

  1. 1

    Conversational Analysis

    Generate charts through natural language dialogue with AI

  2. 2

    Drag-and-Drop GUI

    Visual interface for manual data exploration

  3. 3

    Contextual Memory

    Remembers previous queries for continuous analysis

  4. 4

    Real-Time Visualization

    Instant chart generation from questions

  5. 5

    Data Profiling

    Automatic data transformation and quality checks

vizGPT AI Tool Use Cases

  • 📊
    Create live business dashboards
  • 📈
    Analyze sales trends through chat
  • 🔄
    Transform raw spreadsheets into insights
  • 🔍
    Compare datasets conversationally

FAQs from vizGPT

Do I need coding skills to use vizGPT?

No coding required - use either natural language conversations or the drag-and-drop interface

How does the AI understand my data questions?

Uses advanced natural language processing (NLP) to interpret analysis requests

Can I continue previous analysis sessions?

Yes, contextual memory maintains conversation history for continuous storytelling

Pros & Cons of vizGPT

Pros (4)

  • Eliminates coding requirements for data visualization
  • Combines NLP with traditional GUI workflows
  • Maintains conversation context for complex analysis
  • Real-time chart generation speeds up exploration

Cons (2)

  • Advanced features require account sign-in (based on links)
  • Limited information about data source compatibility

More Info About vizGPT

Who is using vizgpt?

This tool is best for:

  1. Business analysts
  2. Non-technical managers
  3. Data journalists
  4. Market researchers

vizGPT's Tags

Explore more niche AI tool websites by clicking on a tag* (works only if it has enough tools).

#NoCodeAnalytics #DataStorytelling

Website Analytics of vizGPT

vizGPT Website Traffic & SEO Analysis:

Recent data shows that vizGPT has 24.4K monthly visits (117.1% increase from the previous month), 43.0% bounce rate, and average 2.15 pages per visit.
Traffic is primarily driven by 6 different sources, with users from 5 countries worldwide, led by India contributing 21% of total traffic. SEO performance is shown by 5 tracked keywords, with "mp4 to lottie" being the top-performing keyword with 840 monthly searches. See below for more info.

Monthly Visits

24.4K

(+117.1%)

Pages per Visit

2.15

Bounce Rate

43.0%

Average Time on Site

43s

Traffic Trend(Apr 2025 - Sep 2025)

Loading chart...

Top Keywords

SEO KeywordVolumeCPC
mp4 to lottie
840$0.42
video to lottie
580-
video to lottie json
0-
mp4 to lottie json converter
200-
mp4 to json
740-

Traffic Sources Distribution

Traffic Share by Source

Loading chart...

Source Breakdown Details

SourceTraffic Share
Direct
49%
Search
39%
Social
3%
Referrals
7%
Paid Referrals
1%

Global Traffic Distribution

Traffic Share by Country

Loading chart...

Geographic Breakdown Details of top 5 countries

Country NameTraffic Share
India21%
United States14%
Brazil12%
Nigeria8%
Italy6%
Analytics data is estimated (from third-party analytics providers) and for reference only.

🚀 vizGPT Launch Badge

Promote your Toolbit Launch by using the badge on your website. It can be inserted on your home page or footer easily.

How to use: Simply copy and paste the embed code into your homepage or footer HTML to display it instantly and build community support.

ToolBit badge

Reviews for vizGPT