Toolbit.ai
Toolbit.ai

Vizly

Analyze complex datasets using natural language queries

Monthly Visits: 271
Freemium
Free Version
Visit Website
Vizly

What is Vizly?

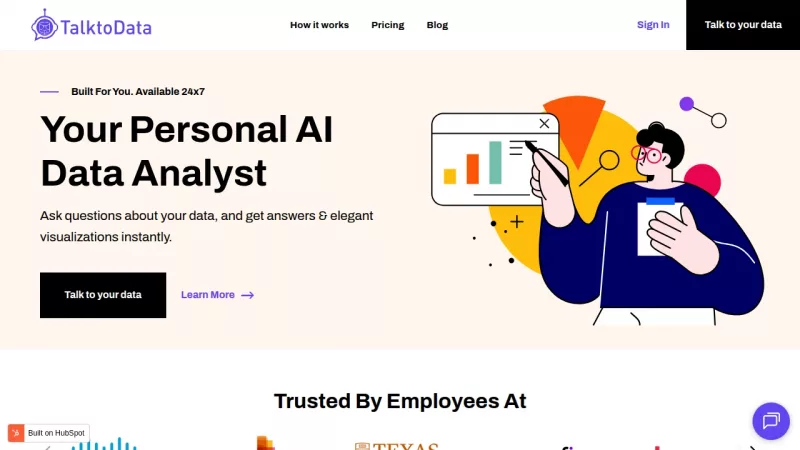
Vizly acts like your AI data analyst, letting you chat with spreadsheets and documents to uncover insights. It automatically generates Python/R code to analyze data and create visualizations. Perfect for professionals who need quick analysis without coding expertise. Private sandbox keeps your data secure during processing.

Key Features of Vizly

  1. 1

    Natural Language Analysis

    Ask data questions in plain English, get statistical answers

  2. 2

    Auto Code Generation

    Produces Python/R code for transparent, customizable analysis

  3. 3

    Interactive Visualizations

    Create charts and graphs through conversational interface

  4. 4

    Multi-Format Support

    Works with Excel, SPSS, CSV, PDFs and Google Sheets

  5. 5

    Secure Sandbox

    Isolated environment with automatic data deletion

Vizly AI Tool Use Cases

  • 🩺
    Detect healthcare trends from patient data
  • 💰
    Uncover financial fraud patterns
  • 🧬
    Analyze genetic research datasets
  • 📊
    Create business dashboards from spreadsheets
  • 📚
    Process academic research data

FAQs from Vizly

Is there a free version?

Yes! Free users get 10 monthly messages with basic features and 1-hour data retention.

How do I start analyzing data?

Upload any supported file type and ask questions in plain English - no coding required.

Do students get discounts?

25% academic discount available when using .edu email or requesting a code.

Pros & Cons of Vizly

Pros (4)

  • No-code interface for complex analysis
  • Transparent code generation for verification
  • Military-grade data security protocols
  • Free tier with 10 monthly analyses

Cons (3)

  • Data auto-deletes after 1 hour (free users)
  • Limited to 10 free queries/month
  • Requires clean data formatting for best results

Vizly's Pricing Plans

Free Plan

monthly
$0

Features

  • 10 monthly messages
  • Basic visualizations
  • 1-hour data retention
For the latest pricing info, please visit the official website

More Info About Vizly

Who is using vizly?

This tool is best for:

  1. Academic researchers
  2. Business analysts
  3. Healthcare data teams
  4. University professors

Vizly's Tags

Explore more niche AI tool websites by clicking on a tag* (works only if it has enough tools).

Integrate Vizly With These Apps

Vizly can be integrated with these apps and services:

  • Excel
  • SPSS
  • Google Sheets

Vizly Social Media

Visit Vizly on social media to stay updated with the latest news and features.

Website Analytics of Vizly

Vizly Website Traffic & SEO Analysis:

Recent data shows that Vizly has 271 monthly visits (-76.0% decrease from the previous month), 37.0% bounce rate, and average 1.07 pages per visit.
Traffic is primarily driven by 6 different sources, with users from 1 countries worldwide, led by United States contributing 100% of total traffic.

Monthly Visits

271

(-76.0%)

Pages per Visit

1.07

Bounce Rate

37.0%

Traffic Trend(Apr 2025 - Sep 2025)

Loading chart...

Traffic Sources Distribution

Traffic Share by Source

Loading chart...

Source Breakdown Details

SourceTraffic Share
Direct
42%
Search
33%
Social
10%
Referrals
13%
Paid Referrals
1%

Global Traffic Distribution

Traffic Share by Country

Loading chart...

Geographic Breakdown Details of top 1 country

Country NameTraffic Share
United States100%
Analytics data is estimated (from third-party analytics providers) and for reference only.

🚀 Vizly Launch Badge

Promote your Toolbit Launch by using the badge on your website. It can be inserted on your home page or footer easily.

How to use: Simply copy and paste the embed code into your homepage or footer HTML to display it instantly and build community support.

ToolBit badge

Reviews for Vizly