Toolbit.ai
Toolbit.ai
Customer InsightsAI ReportingProduct Analytics

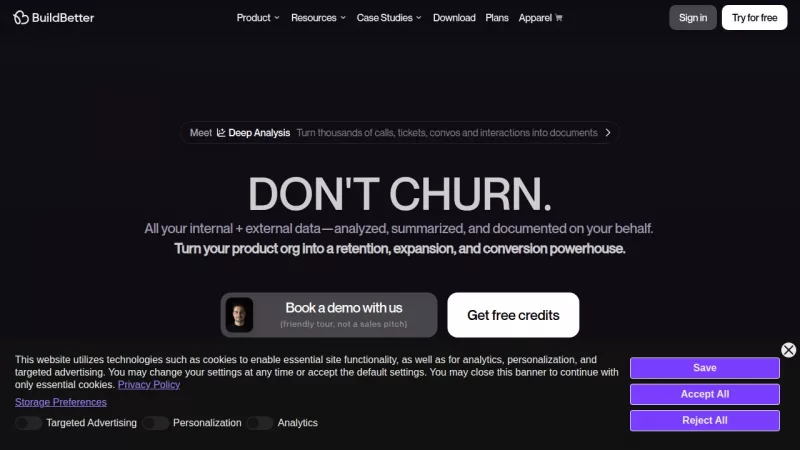
BuildBetter

Transform customer data into actionable insights for product teams

Monthly Visits: 17.8K
Custom
Visit Website
BuildBetter

What is BuildBetter?

BuildBetter uses AI to analyze all your customer interactions and data, turning them into clear reports and insights. This helps teams save time by automating data analysis, so they can focus on revenue-generating activities. It's designed with strong privacy controls to keep your data secure and not used for model training.

Key Features of BuildBetter

  1. 1

    Reports

    Instantly create fully cited reports from customer data

  2. 2

    Signals

    Turn interactions into searchable insights for easy access

  3. 3

    Workflows

    Automate insights delivery with reusable workflows

  4. 4

    Unlimited Seats

    Provide access to entire organization without extra costs

  5. 5

    Privacy

    Ensure data security with no model training on user data

BuildBetter AI Tool Use Cases

  • 📊
    Generate customer feedback reports
  • 🔍
    Search for actionable insights
  • 🔄
    Automate data analysis workflows
  • 💼
    Improve product retention strategies

Pros & Cons of BuildBetter

Pros (4)

  • Saves 18 hours per project on average
  • Reduces meetings by 26 per month per team
  • Unlimited seat access for entire org
  • Strong privacy and security protocols

Cons (2)

  • Primarily for B2B teams, not individuals
  • May require setup and integration effort

More Info About BuildBetter

Who is using buildbetter?

This tool is best for:

  1. Product Managers
  2. Marketing Teams
  3. Sales Teams
  4. Engineering Teams

BuildBetter's Tags

Explore more niche AI tool websites by clicking on a tag* (works only if it has enough tools).

#AITools #ProductAnalytics#B2B#CustomerInsights

Website Analytics of BuildBetter

BuildBetter Website Traffic & SEO Analysis:

Recent data shows that BuildBetter has 17.8K monthly visits (-24.0% decrease from the previous month), 51.0% bounce rate, and average 1.49 pages per visit.
Traffic is primarily driven by 6 different sources, with users from 5 countries worldwide, led by United Kingdom contributing 26% of total traffic. SEO performance is shown by 5 tracked keywords, with "buildbetter" being the top-performing keyword with 1.2K monthly searches. See below for more info.

Monthly Visits

17.8K

(-24.0%)

Pages per Visit

1.49

Bounce Rate

51.0%

Average Time on Site

20s

Traffic Trend(Jul 2025 - Sep 2025)

Loading chart...

Top Keywords

SEO KeywordVolumeCPC
buildbetter
1.2K$1.53
llm and positive
100-
which ai is best for feedback
60-
kraftful
1.8K$19.02
build better
130-

Traffic Sources Distribution

Traffic Share by Source

Loading chart...

Source Breakdown Details

SourceTraffic Share
Direct
38%
Search
42%
Social
9%
Referrals
10%
Paid Referrals
1%

Global Traffic Distribution

Traffic Share by Country

Loading chart...

Geographic Breakdown Details of top 5 countries

Country NameTraffic Share
United Kingdom26%
United States20%
India17%
Brazil10%
Spain4%
Analytics data is estimated (from third-party analytics providers) and for reference only.

🚀 BuildBetter Launch Badge

Promote your Toolbit Launch by using the badge on your website. It can be inserted on your home page or footer easily.

How to use: Simply copy and paste the embed code into your homepage or footer HTML to display it instantly and build community support.

ToolBit badge

Reviews for BuildBetter