Toolbit.ai
Toolbit.ai

Infografix

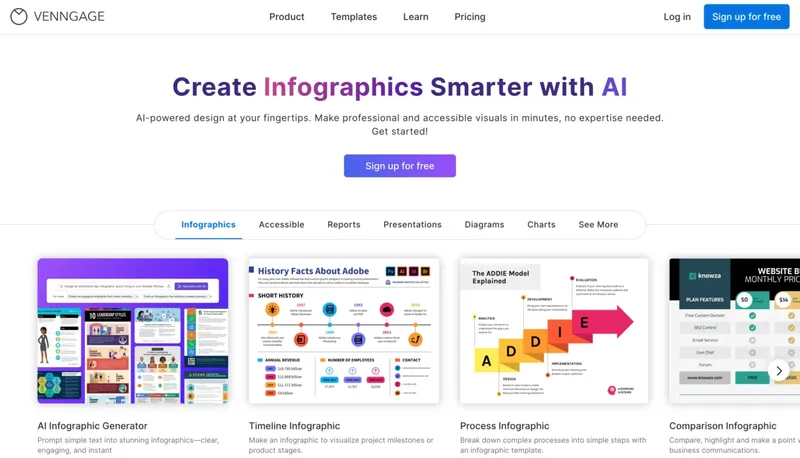
Create professional infographics instantly using AI-powered templates

Monthly Visits: 64.7K
Free
Free Version
Visit Website
Infografix

What is Infografix?

Infografix lets anyone make eye-catching infographics in minutes without design experience. Simply type your content and let AI generate visual timelines, process maps, or hierarchies. Export directly to presentations or social media with customizable colors and fonts.

Key Features of Infografix

  1. 1

    AI Generation

    Transforms text prompts into complete infographic layouts

  2. 2

    15+ Templates

    Timelines, SWOT analyses, mind maps, and family trees

  3. 3

    Brand Customization

    1,500+ fonts and custom color themes for branding

  4. 4

    Multi-Format Export

    Save as PNG, JPG, SVG, or PDF for any use case

Infografix AI Tool Use Cases

  • 🎓
    Enhance college assignments
  • 💼
    Create business presentations
  • 📱
    Post social media visuals
  • Build historical timelines
  • 🎨
    Apply brand colors/styles

FAQs from Infografix

Do I need design experience to use Infografix?

No - the AI generates complete designs from text prompts automatically

What file formats can I export?

PNG, JPG, SVG, and PDF for presentations or printing

Can I use this on mobile devices?

Yes - native apps available for iOS and Android, plus web access

Pros & Cons of Infografix

Pros (4)

  • No graphic design skills required
  • Mobile app and web access
  • 1500+ Google Font integrations
  • Free to use with multiple export formats

Cons (3)

  • Limited to template-based designs
  • No advanced vector editing tools
  • Custom themes require manual setup

More Info About Infografix

Who is using infografix?

This tool is best for:

  1. Students/Educators
  2. Business Professionals
  3. Content Marketers
  4. Non-Designers

Infografix's Tags

Explore more niche AI tool websites by clicking on a tag* (works only if it has enough tools).

#AIContentCreation #BrandedContent#InfographicGenerator

Platforms & Device Support

Use Infografix on your favorite device - available across multiple platforms for flexibility.

Mobile App

iPhone
Get App
Android Phones
Get App

Website Analytics of Infografix

Infografix Website Traffic & SEO Analysis:

Recent data shows that Infografix has 64.7K monthly visits (-25.6% decrease from the previous month), 39.0% bounce rate, and average 1.79 pages per visit.
Traffic is primarily driven by 6 different sources, with users from 5 countries worldwide, led by India contributing 8% of total traffic. SEO performance is shown by 5 tracked keywords, with "infografix" being the top-performing keyword with 890 monthly searches. See below for more info.

Monthly Visits

64.7K

(-25.6%)

Pages per Visit

1.79

Bounce Rate

39.0%

Average Time on Site

30s

Traffic Trend(Apr 2025 - Sep 2025)

Loading chart...

Top Keywords

SEO KeywordVolumeCPC
infografix
890$0.65
infographic
233.5K$0.87
ai infographic generator
9.1K$2.39
infography
5.7K$3.73
infographic ai
5.4K$0.83

Traffic Sources Distribution

Traffic Share by Source

Loading chart...

Source Breakdown Details

SourceTraffic Share
Direct
35%
Search
49%
Social
4%
Referrals
11%
Paid Referrals
1%

Global Traffic Distribution

Traffic Share by Country

Loading chart...

Geographic Breakdown Details of top 5 countries

Country NameTraffic Share
India8%
Hong Kong7%
United States7%
Germany5%
Nigeria5%
Analytics data is estimated (from third-party analytics providers) and for reference only.

🚀 Infografix Launch Badge

Promote your Toolbit Launch by using the badge on your website. It can be inserted on your home page or footer easily.

How to use: Simply copy and paste the embed code into your homepage or footer HTML to display it instantly and build community support.

ToolBit badge

Reviews for Infografix