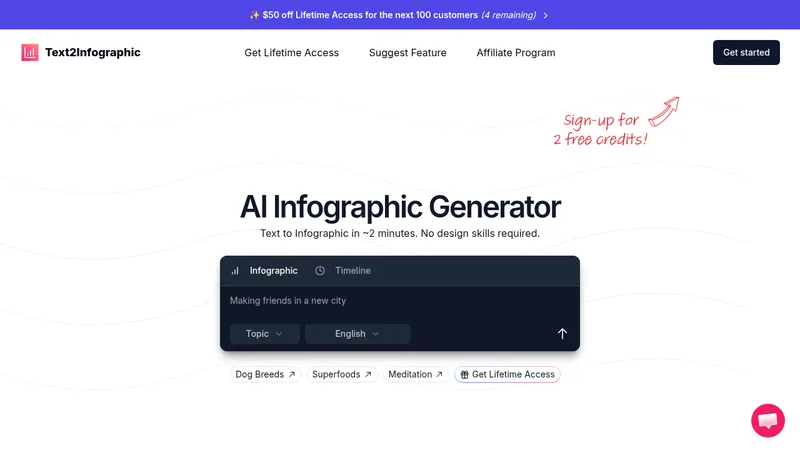
Text2Infographic

Transform text into professional infographics in 2 minutes

Monthly Visits: 42.9K
One-Time Payment
Visit Website
Text2Infographic

What is Text2Infographic?

Turn any text or blog post into ready-to-use infographics without design experience. Saves 99% of the time compared to manual design processes while maintaining professional quality. Ideal for content creators who need visual assets quickly and affordably.

Key Features of Text2Infographic

  1. 1

    AI-Powered Design

    Professional layouts generated automatically without manual effort

  2. 2

    Instant Research

    Automated content analysis and data summarization in seconds

  3. 3

    Auto Visuals

    Relevant images sourced and integrated without user input

  4. 4

    Commercial Rights

    Create infographics for client work or business use

Text2Infographic AI Tool Use Cases

  • 📝
    Create blog post visuals
  • 📊
    Simplify data presentation
  • 📱
    Generate social media content
  • 💼
    Produce client reports
  • 🌐
    Multi-language infographics

FAQs from Text2Infographic

Do I need design experience to use this tool?

No design skills required - the AI handles layout and visual creation automatically

Can I customize the generated infographics?

Brand integration is supported, but specific customization options aren't detailed

Is commercial use allowed?

Yes, the lifetime plan includes full commercial rights for client work

Pros & Cons of Text2Infographic

Pros (4)

  • Reduces 9-hour design process to 2 minutes
  • No graphic design skills required
  • Includes commercial usage rights
  • Supports 20+ languages

Cons (2)

  • Limited customization options mentioned
  • No team collaboration features specified

Text2Infographic's Pricing Plans

Lifetime Access

one-time
$70

Features

  • Unlimited infographics
  • Commercial rights
  • 20+ language support
  • Brand integration
  • Lifetime updates
For the latest pricing info, please visit the official website

More Info About Text2Infographic

Who is using text2infographic?

This tool is best for:

  1. Content creators
  2. Bloggers
  3. Social media managers
  4. Small business owners

Text2Infographic's Tags

Explore more niche AI tool websites by clicking on a tag* (works only if it has enough tools).

#NoCodeDesign #BloggingTools #VisualMarketing#AIIinfographic

Website Analytics of Text2Infographic

Text2Infographic Website Traffic & SEO Analysis:

Recent data shows that Text2Infographic has 42.9K monthly visits (-11.2% decrease from the previous month), 40.0% bounce rate, and average 1.71 pages per visit.
Traffic is primarily driven by 6 different sources, with users from 5 countries worldwide, led by United States contributing 15% of total traffic. SEO performance is shown by 5 tracked keywords, with "text2infographic" being the top-performing keyword with 1.4K monthly searches. See below for more info.

Monthly Visits

42.9K

(-11.2%)

Pages per Visit

1.71

Bounce Rate

40.0%

Average Time on Site

24s

Traffic Trend(Apr 2025 - Oct 2025)

Loading chart...

Top Keywords

SEO KeywordVolumeCPC
text2infographic
1.4K-
text to infographic
1.4K$2.19
ai infographic generator
8.3K$3.19
инфографика по тексту
0-
infographic generator ai
2.8K$1.16

Traffic Sources Distribution

Traffic Share by Source

Loading chart...

Source Breakdown Details

SourceTraffic Share
Direct
34%
Search
47%
Social
5%
Referrals
13%
Paid Referrals
1%

Global Traffic Distribution

Traffic Share by Country

Loading chart...

Geographic Breakdown Details of top 5 countries

Country NameTraffic Share
United States15%
India9%
Colombia7%
Russia5%
Vietnam5%
Analytics data is estimated (from third-party analytics providers) and for reference only.

🚀 Text2Infographic Launch Badge

Promote your Toolbit Launch by using the badge on your website. It can be inserted on your home page or footer easily.

How to use: Simply copy and paste the embed code into your homepage or footer HTML to display it instantly and build community support.

ToolBit badge

Reviews for Text2Infographic