Toolbit.ai
Toolbit.ai

Narrative BI

Transform raw business data into actionable AI-powered narratives

Monthly Visits: 50.6K
Tiered Subscription
Visit Website
Narrative BI

What is Narrative BI?

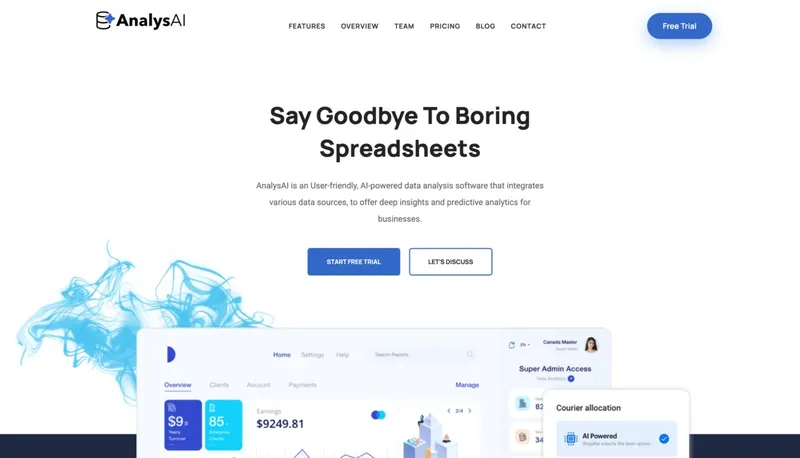
Narrative BI automatically analyzes your marketing, sales, and advertising data to surface key insights without manual work. It connects to popular platforms like Google Analytics and Facebook Ads, then uses AI to explain trends and anomalies in plain language. Non-technical teams can quickly understand performance drivers and make data-driven decisions.

Key Features of Narrative BI

  1. 1

    AI-Powered Analysis

    Automatically generates plain-language insights from complex datasets

  2. 2

    Cross-Platform Integration

    Connects Google Ads, Facebook Ads, HubSpot in 2 clicks

  3. 3

    Smart Alerts

    Proactively detects unusual metric changes in real-time

  4. 4

    Slack Reports

    Delivers key insights directly to team communication channels

  5. 5

    Automated Dashboards

    Creates dynamic reports without manual data wrangling

Narrative BI AI Tool Use Cases

  • ๐Ÿ“ˆ
    Analyze marketing campaign performance
  • ๐Ÿ’ผ
    Track sales pipeline health
  • ๐Ÿ›๏ธ
    Optimize e-commerce metrics
  • ๐Ÿ“Š
    Monitor website traffic trends
  • ๐Ÿ””
    Receive anomaly alerts in Slack

FAQs from Narrative BI

How quickly can I get started with Narrative BI?

Connect your first data source in 2 clicks and receive initial insights within 24 hours

Do I need technical skills to use this platform?

No coding required - designed for marketers and business users

How does the AI avoid data hallucinations?

Uses proprietary algorithms focused on statistically significant changes

Pros & Cons of Narrative BI

Pros (4)

  • No-code setup for non-technical users
  • Real-time anomaly detection
  • Centralized view across multiple platforms
  • AI explanations help interpret complex data

Cons (3)

  • Primarily focused on SMEs rather than enterprises
  • Limited third-party integrations beyond core marketing tools
  • Advanced customization may require learning curve

Narrative BI's Pricing Plans

Starter

monthly
$299

Features

  • 5 data sources
  • Basic analytics
  • Email support
  • Standard report frequency

Growth

monthly
$599

Features

  • 15 data sources
  • AI-powered insights
  • Slack integration
  • Priority support

Enterprise

annual
Custom

Features

  • Unlimited data sources
  • Dedicated CSM
  • SLA guarantees
  • Custom integrations
For the latest pricing info, pleaseย visit the official website

More Info About Narrative BI

Who is using narrative bi?

This tool is best for:

  1. Digital marketing teams
  2. E-commerce managers
  3. Sales operations teams
  4. Growth-focused agencies

Narrative BI's Tags

Explore more niche AI tool websites by clicking on a tag* (works only if it has enough tools).

#DataAnalysis #MarketingInsights#AutomatedReporting#SMEgrowth

Integrate Narrative BI With These Apps

Narrative BI can be integrated with these apps and services:

  • Google Analytics
  • Google Ads
  • Facebook Ads
  • HubSpot
  • Salesforce
  • Slack

Narrative BI Social Media

Visit Narrative BI on social media to stay updated with the latest news and features.

Website Analytics of Narrative BI

Narrative BI Website Traffic & SEO Analysis:

Recent data shows that Narrative BI has 50.6K monthly visits (79.2% increase from the previous month), 39.0% bounce rate, and average 1.97 pages per visit.
Traffic is primarily driven by 6 different sources, with users from 5 countries worldwide, led by United States contributing 25% of total traffic. SEO performance is shown by 5 tracked keywords, with "narrative bi" being the top-performing keyword with 1.9K monthly searches. See below for more info.

Monthly Visits

50.6K

(+79.2%)

Pages per Visit

1.97

Bounce Rate

39.0%

Average Time on Site

24s

Traffic Trend(May 2025 - Jul 2025)

Loading chart...

Top Keywords

SEO KeywordVolumeCPC
narrative bi
1.9K$10.81
gemini gem for data analytics
230-
does chatgpt have a search console
210-
narrative bi:
170-
read csv and give portfolio analysis ai
160-

Traffic Sources Distribution

Traffic Share by Source

Loading chart...

Source Breakdown Details

SourceTraffic Share
Direct
38%
Search
46%
Social
5%
Referrals
10%
Paid Referrals
1%

Global Traffic Distribution

Traffic Share by Country

Loading chart...

Geographic Breakdown Details of top 5 countries

Country NameTraffic Share
United States25%
India8%
United Kingdom4%
Indonesia4%
Vietnam4%
Analytics data is estimated (from third-party analytics providers) and for reference only.

๐Ÿš€ Narrative BI Launch Badge

Promote your Toolbit Launch by using the badge on your website. It can be inserted on your home page or footer easily.

How to use: Simply copy and paste the embed code into your homepage or footer HTML to display it instantly and build community support.

ToolBit badge

Reviews for Narrative BI