Cerbrec is an AI Operations Platform that deploys AI agents to analyze live sensor data and coordinate real-time adjustments across complex systems in data centers, manufacturing, energy, and supply chain operations. It moves operations from reactive to resilient by unifying signals from power, cooling, production lines, and equipment into a single intelligence layer.
Key Features
- Predictive Risk Intelligence: Connects all signals to identify issues early and resolve them before they escalate.
- Optimized Operational Efficiency: Surfaces inefficiencies and helps teams act without adding complexity.
- Built-In Compliance: Standardizes diagnostics and actions to ensure traceability and auditability.
Use Cases
- Data Centers: AI agents orchestrate end-to-end optimization, achieving 1.42 PUE (down from 1.85), 38% lower energy consumption, and $2–4M annual savings.
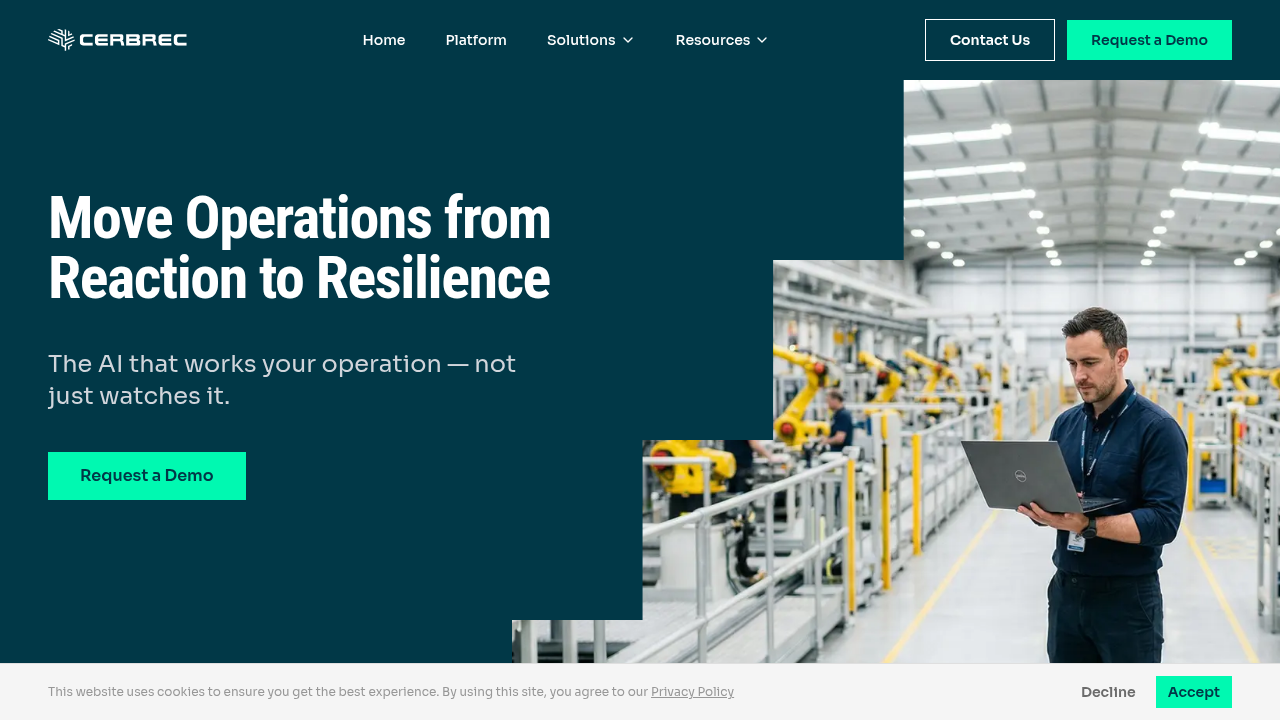
- Manufacturing: Automates root cause analysis across production lines, reducing unplanned downtime by 40–60% and improving Overall Equipment Effectiveness from 65% to 82%.
- Energy: Unifies power and cooling into one intelligent system, cutting PUE by 4% and energy per inference by 42%.
- Supply Chain: Predicts part needs weeks before failure, reducing maintenance costs by 20–30% and increasing equipment availability to 97%.
Cerbrec is trusted by enterprises running critical operations and is backed by SRI, AWS Generative AI Accelerator, and VIPC.
Key Benefits
- Achieved 1.42 PUE in data centers, down from 1.85
- Reduced unplanned downtime by 40–60% in manufacturing
- Built-in compliance for traceable and auditable actions
- Predictive risk intelligence to identify issues early