Toolbit.ai
Toolbit.ai
Qualitative ResearchVoice SurveysVideo Surveys

Phonic

Collect rich qualitative insights with voice and video surveys

Monthly Visits: 8.3K
Visit Website
Phonic

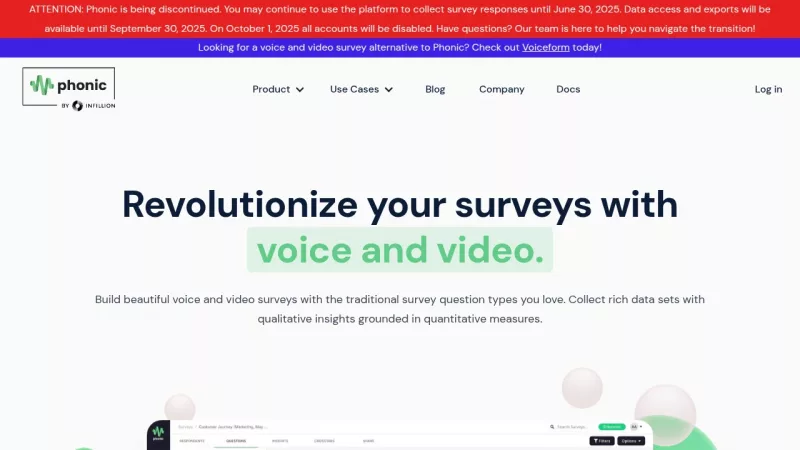
What is Phonic?

Phonic lets you create surveys that use audio and video responses instead of just text. This helps you gather more detailed and emotional feedback from participants. With AI-powered analysis, you can quickly transcribe and understand the data without manual effort.

Key Features of Phonic

  1. 1

    Survey Design

    Build surveys with audio, video, and screen recording options

  2. 2

    AI Analysis

    Automatic transcription and sentiment analysis for faster insights

  3. 3

    Multi-language

    Transcribe responses in 32 languages with free translation

  4. 4

    Media Storage

    Store unlimited audio and video files in the cloud

  5. 5

    Integration

    Embed surveys on websites or use with third-party platforms

Phonic AI Tool Use Cases

  • 🔍
    Market Research
  • 🎓
    Academic Research
  • 💬
    Consumer Insights
  • 🏥
    Healthcare Research
  • 🤖
    AI Research

FAQs from Phonic

Is Phonic still available for use?

Phonic is being discontinued; you can use it to collect survey responses until June 30, 2025, with data access until September 30, 2025.

What happens to my data after discontinuation?

All accounts will be disabled on October 1, 2025, and data access will not be available after that date.

Are there alternatives to Phonic?

The website suggests Voiceform as an alternative for voice and video surveys.

Pros & Cons of Phonic

Pros (4)

  • User-friendly interface for easy survey creation
  • AI-enabled features accelerate data analysis
  • Supports multiple languages and translations
  • Unlimited media storage for all responses

Cons (3)

  • Platform is being discontinued in 2025
  • Limited to specific research use cases
  • No future updates or support after discontinuation

More Info About Phonic

Who is using phonic?

This tool is best for:

  1. Market Researchers
  2. Academic Researchers
  3. UX Researchers
  4. Healthcare Professionals

Phonic's Tags

Explore more niche AI tool websites by clicking on a tag* (works only if it has enough tools).

#CustomerFeedback #MarketResearch#QualitativeData#VoiceSurveys#VideoSurveys

Phonic Social Media

Visit Phonic on social media to stay updated with the latest news and features.

Website Analytics of Phonic

Phonic Website Traffic & SEO Analysis:

Recent data shows that Phonic has 8.3K monthly visits (1.3% increase from the previous month), 55.0% bounce rate, and average 1.55 pages per visit.
Traffic is primarily driven by 6 different sources, with users from 4 countries worldwide, led by United States contributing 63% of total traffic. SEO performance is shown by 5 tracked keywords, with "phonic ai" being the top-performing keyword with 520 monthly searches. See below for more info.

Monthly Visits

8.3K

(+1.3%)

Pages per Visit

1.55

Bounce Rate

55.0%

Average Time on Site

25s

Traffic Trend(Jul 2025 - Sep 2025)

Loading chart...

Top Keywords

SEO KeywordVolumeCPC
phonic ai
520$2.78
phonic
3.0K$2.95
phonic ai survey app
10-
kajal pandey leaked
580-
voice form
260-

Traffic Sources Distribution

Traffic Share by Source

Loading chart...

Source Breakdown Details

SourceTraffic Share
Direct
49%
Search
36%
Social
7%
Referrals
7%
Paid Referrals
1%

Global Traffic Distribution

Traffic Share by Country

Loading chart...

Geographic Breakdown Details of top 4 countries

Country NameTraffic Share
United States63%
India19%
Spain13%
Vietnam5%
Analytics data is estimated (from third-party analytics providers) and for reference only.

🚀 Phonic Launch Badge

Promote your Toolbit Launch by using the badge on your website. It can be inserted on your home page or footer easily.

How to use: Simply copy and paste the embed code into your homepage or footer HTML to display it instantly and build community support.

ToolBit badge

Reviews for Phonic