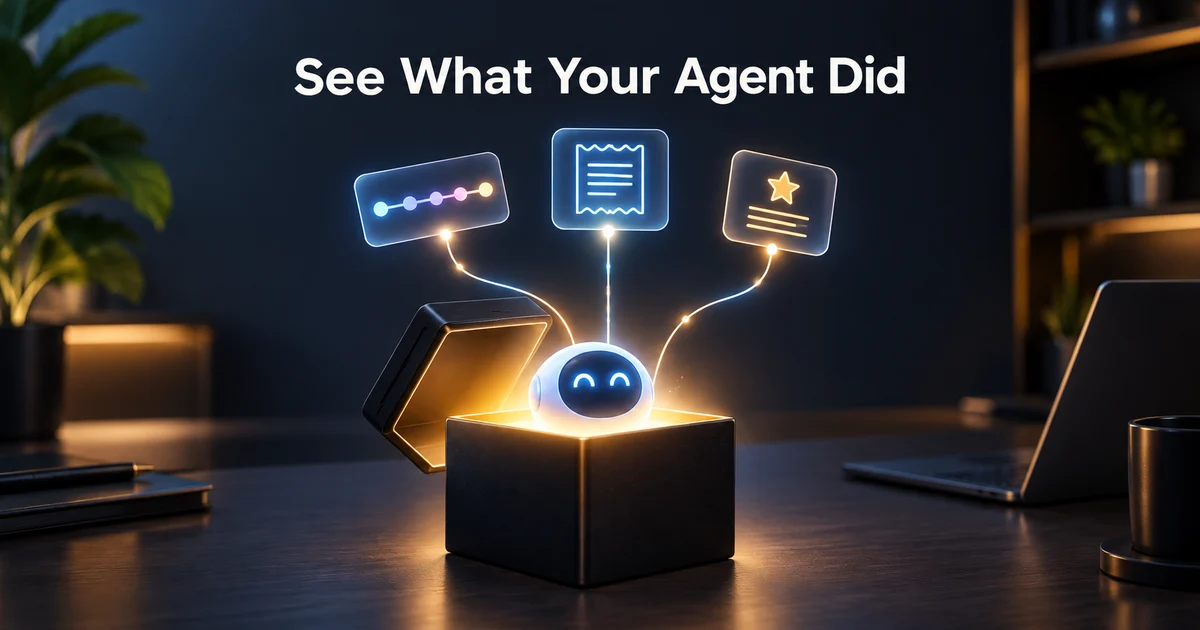
AI agent observability is the practice of recording every run your agent makes: every step, every tool call, every token, every error. With that record saved, the question "what did my agent actually do?" finally has a real answer.
It's 3am and your phone buzzes. Your AI agent, shipped two weeks ago and quietly fine ever since, just did something weird. Maybe it emailed the wrong customer. Maybe it called the same tool three times in a row for no reason you can see. Maybe your bill shows one single reply that cost 40 cents, when every other reply costs a fraction of a cent.
By morning your teammate asks the only question that matters: "What did it actually do?" And you can't say. You have a mystery box. It worked yesterday. It broke today. The only evidence you have is an output you didn't like.
Here's the hard part. A normal bug is chaseable: you run the code again, watch it step by step, and see where it goes wrong. Agents don't work like that. They are non-deterministic. That's a fancy word for a simple idea: same input, different output. You can't re-run and watch. The weird run happened once, and it's gone. Langfuse, one of the observability platforms we'll meet later, puts it plainly: because AI is non-deterministic, debugging without observability "is more like guesswork."
Guessing is the problem. Recording is the fix. This post is about the recording.
In short:
- An agent is a black box unless you turn on recording.
- A trace is the flight recorder for one run: every step, in order.
- Watch three things: what happened (the steps), what it cost (tokens and time), and whether it worked (quality).
- You can write a real trace log yourself in five minutes: one file, plain JSON, no platform.
- Evals score your agent before you ship; observability watches it after. You need both.
By the end you'll know what to record, how to read it back, and when a platform is worth your time.
The 3am problem: your agent did something weird
Picture a magic vending machine. You press a button, a snack falls out, everyone is happy. A curtain hides how the machine decides which snack to drop. Most days you don't care about the curtain. Then one day the machine throws out ten snacks for one coin. You want to open the curtain and look inside. You can't. All you have is the pile of snacks.
That's an agent with no observability.
An AI agent is a black box by default. Your code sees the request it sends and the reply it gets back. The steps in between are invisible.
Why are agents black boxes by default? Because of where the work happens. From your code's point of view, an agent run is one API request. Your code sends messages in and gets a message back. But inside that request, a whole story unfolds: the model thinks, decides to call a tool, reads the tool's answer, thinks again, and finally replies. If your code doesn't write any of that down as it happens, only the last page of the story survives. The middle pages are gone.
And you can't get them back by trying again. Remember: non-deterministic. The run you want to inspect happened exactly once and left no notes.
So you're left guessing, and guessing costs you three things:
- You can't debug. You can't fix what you can't see.
- You can't prove anything. "It worked on my machine" becomes "I think it emailed the customer twice, maybe?" That's not an answer your teammate can use.
- You can't improve. Getting better starts with knowing which step failed. No recording, no starting line.
The flight recorder: what observability means
Airplanes carry a flight recorder. People call it the black box. When something goes wrong mid-flight, investigators don't guess. They replay the recording: every flap of a wing, every word in the cockpit, all saved while nothing was wrong yet.
Observability is the flight recorder for your agent. It means always-on recording of every run. Langfuse describes the core of it as application tracing: structured logs of every request that capture "the exact prompt sent, the model's response, token usage, latency, and any tools or retrieval steps in between."
Why always-on? Think of a security camera. It records even when nothing is wrong, all day, because you only find out you needed the footage after something happens. You can't film the past. Same with agents: you only learn that Tuesday's weird run mattered after Tuesday.
One honest limit before we go further. Observability doesn't make your agent behave. It shows you what happened. Seeing is not the same as trusting blindly: you still have to read the recording and act on it.
Two words to learn, first like a kid, then precisely:
- A trace is the recording of one whole run. It's the path of one request through your agent, from arrival to final answer. In kid terms: the whole flight, takeoff to landing.
- A span is one line in that recording. One unit of work with a name, a start, an end, and a parent. In kid terms: one line in the flight log. "Takeoff at 9:02." "Pilot asked for weather at 9:03."
The trace vs span difference in one line: a span is one step, and a trace is all the steps of one run.
Now precisely, from OpenTelemetry (OTel for short), the industry-standard way to describe this stuff: a trace shows "the path of a request through your application," and "a span represents a unit of work or operation. Spans are the building blocks of traces." If you want the full anatomy of traces and spans, with diagrams and worked examples, OpenTelemetry's traces documentation is the canonical read.
Three layers of sight
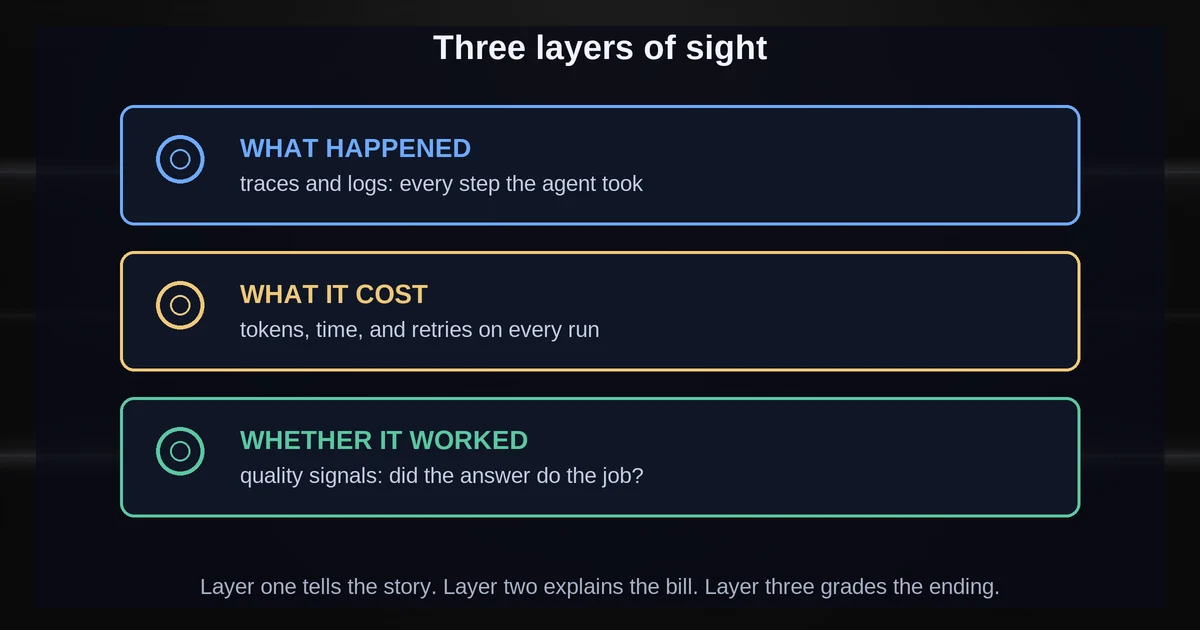
Imagine three camera lenses stacked over the same scene. Lens 1 shows what the agent did. Lens 2 shows what it spent. Lens 3 shows whether the result was any good. Each lens sees part of the truth. Watch through all three, or you only see part of the story.
LLM observability gives you three layers of sight: traces and logs for what happened, receipts for what it cost, and quality signals for whether it worked.
Layer 1: what happened (traces and logs)
A trace is a tree of spans. Every span in one run carries the same trace_id, like a name tag that says "we all belong to this run." Each span also carries a parent_id pointing at the span that caused it. The root span, the one with no parent, is the whole run. Its children are the steps: each model call, each tool call, each lookup. That's the official shape, straight from OpenTelemetry, and every platform in this post uses some version of it.
Platforms use different words for the same shape, which confuses everyone at first. Here's the dictionary:
- Langfuse calls each step an observation (an LLM call, a tool call, a retrieval step, and steps can nest inside steps). Observations group into a trace (one request), and the traces of one user conversation group into a session.
- LangSmith records each unit of work as a run. Runs collect into a trace, and multi-turn traces link into a thread. LangSmith's docs bridge the vocabularies in one line: "If you are familiar with OpenTelemetry, you can think of a run as a span."
Different words, same shape: steps, grouped into runs, grouped into conversations. Once you see the shape, the vocabulary stops mattering.
Layer 2: what it cost (tokens, time, retries)
Every LLM call hands you a receipt. The receipt says exactly how many tokens went in and how many came out. The field names differ a little by vendor, so here they are, confirmed from each vendor's own API docs:
| Vendor | Where the receipt lives | Field names |
|---|---|---|
| OpenAI | the usage object in the response | prompt_tokens, completion_tokens, total_tokens |
| Anthropic | the usage object in the response | input_tokens, output_tokens |
Depending on the model, you may see extra fields on the receipt too, like cached tokens or audio tokens. The core pair is always the same idea: tokens in, tokens out.
One caveat with streaming, and it bites people weekly. When a reply streams out word by word, the usage numbers arrive only in the final chunk, and only if you asked for them. In OpenAI's API you must set stream_options: {"include_usage": true}. If the stream gets interrupted early, a user hits stop, a connection drops, you may never see the receipt at all. Practical rule: log usage at the end of a call, once, not chunk by chunk.
Layer 3: whether it worked (quality)
Receipts tell you what you paid. They don't tell you whether the meal was good. For that you need quality signals, and there are three common kinds, all supported by Langfuse:
- User feedback: the thumbs up or thumbs down from a real person.
- LLM-as-a-judge: a second model reads the output and scores it against rules you set.
- Manual labeling: a human looks at a sample of outputs and marks them good or bad.
Layer 2 says the run cost two cents. Layer 3 says the answer was wrong anyway. You need both lenses to know those two cents were wasted.
For a full map of what a trace should capture across all three layers, Langfuse's observability overview is a good next stop.
What to record on every run
Think of the security camera that never blinks. It doesn't decide what's interesting. It doesn't record only the moments it suspects. It records everything, because nobody knows what will matter until something breaks.
The short answer: record the exact prompt, the model's response, token usage, latency, every tool or retrieval step, and the run's final status.
Your agent's camera should record the same way. Here is the canonical list of what a trace should capture, straight from Langfuse's observability docs:
- the exact prompt sent (every message, word for word)
- the model's response
- token usage (the receipt for each call)
- latency (how long each step took)
- every tool or retrieval step in between
- and, so the story ends properly: errors and the final status of the run (that last one is OpenTelemetry's idea, from the span list just below)
Then, at the level of a single step, every span should carry at minimum the fields OpenTelemetry gives every span:
- a name (what this step was, like
get_order_status) - the trace_id (which run it belongs to)
- the parent_id (which step caused it)
- start and end timestamps
- a status (finished okay, or errored out)
- attributes (any extra key-value info you want to hang on it)
- events (things that happened at a moment inside the step)
One pitfall to decide on early, boxed because it matters:
Sensitive data gets recorded too. Default tracing captures inputs and outputs, and those can hold customer names, secrets, or personal data. The OpenAI Agents SDK, whose tracing is on by default, says it directly: these records "may contain sensitive data." It also gives you a switch to turn sensitive capture off (
RunConfig.trace_include_sensitive_data=False). Decide what you redact, and write the rule down, before you turn recording on, not after someone asks what's in the log.
Two practical notes before the workflow:
- In streaming mode, log usage at the end of the call, not per chunk. The usage only arrives in the final chunk, if it arrives at all. If you log per chunk, you'll log a lot of zeroes and maybe never the real number.
- The message history is yours to keep. Anthropic's Messages API is stateless: the server remembers nothing between turns, and your code resends the full conversation history with every request. That sounds like a chore, but it means the whole conversation is in your hands to log, with nothing hidden on a server somewhere.
How to read a trace: the detective's workflow
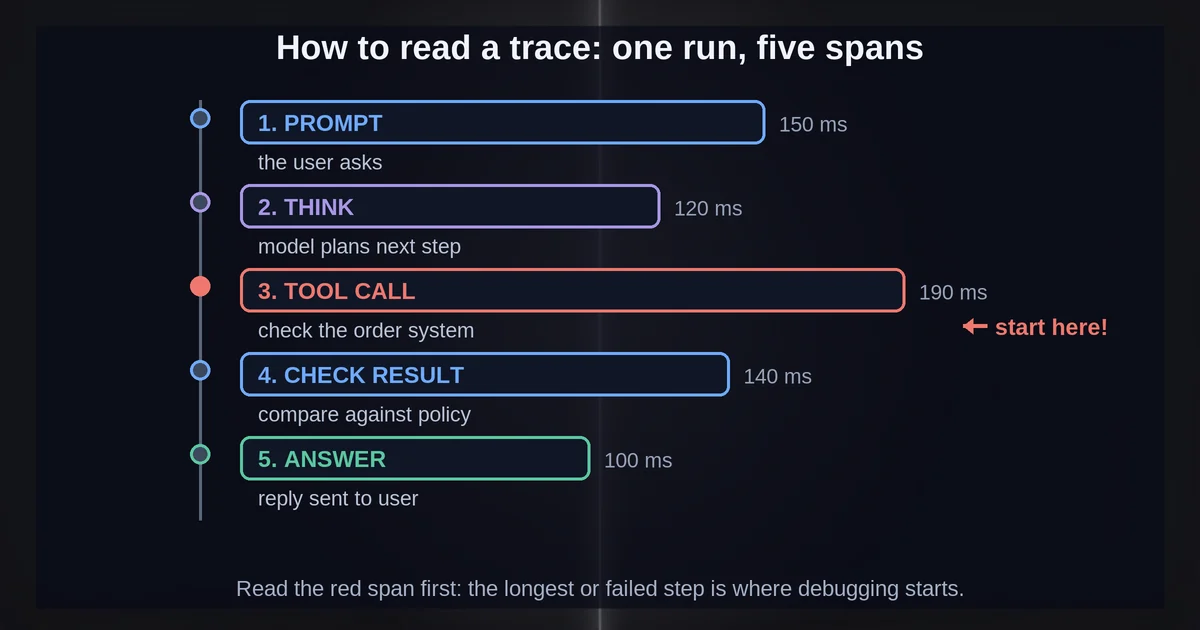
A trace reads like a detective's case file. The crime scene photos are in order. Each photo is labeled with who and when. You read the file top-down, find the first photo where things look wrong, and treat everything after it as fallout.
The core move in agent debugging is simple: read the trace top-down, find the first step marked error, and treat everything after it as fallout.
Here's the workflow, step by step:
-
Read top-down, find the first failing step. Spans carry status. In OpenTelemetry, a span that did its work cleanly ends with an okay status; a span that failed ends with an error status. So: scan the trace top-down, find the first span marked error, and open it up. Look at its inputs and outputs. Everything after that first failure is probably fallout, not cause. Fix the first wrong photo, and the rest of the story usually makes sense.
-
Spot the retry loop. The signature is unmistakable: the same tool span, with the same arguments, repeating over and over under one trace_id. Platforms know this failure mode hurts. LangSmith literally rejects runs beyond 25,000 in a single trace, a hard ceiling a runaway loop will eventually smash into. The DIY log you'll build later in this post has no ceiling, so you spot loops by eye: steps 12, 13, 14, and 15 all named
get_order_statuswith the sameorder_id. That's your loop. -
Spot the wrong tool. Compare the tool span the model chose against the tools the agent actually had. The model's choice is recorded, and its inputs are recorded, so "why did it call that?" stops being a shrug and becomes a readable question: here is the plan it wrote, here is the tool it picked, here is what it sent. Often, the input shows the model grabbed the wrong argument or misread what a tool was for.
-
Spot the runaway cost. Sum the receipts. Add up
prompt_tokensandcompletion_tokens(OpenAI) orinput_tokensandoutput_tokens(Anthropic) across every generation span in the run, then apply your model's price. That's one run's real price tag. When one run costs ten times its siblings, the trace shows you which step burned the tokens. Usually it's the step with the enormous prompt.
Two more moves for the long game:
- Replay. A saved trace can be replayed. LangSmith's framing is the memorable one: add real traces to a dataset so "a failure you saw once becomes a test you run every time." The honest caveat: models are non-deterministic, so replay means same inputs, not guaranteed same outputs. You're re-running the experiment, not rewinding the tape.
- Drift. Drift is a car slowly pulling to one side over months. Nothing breaks on any given day, but the steering is off by a little more each week. Agents drift too: costs creep up, quality slides down. The fix is not staring at individual runs. It's charting weekly totals: average cost per run, quality scores, the share of runs that errored. Watch the trend line, not the cars.
If you want to see what a production-grade version of this looks like, LangSmith's observability docs walk the same moves with a UI around them.
Your five-minute flight recorder
You don't need a Hollywood studio to film your driveway. A phone on a tripod records fine. You also don't need a platform to record your agent. One append-only file records fine.
Agent tracing does not need a platform to start. One append-only JSONL file, one JSON object per run, gets you a real trace log today.
The pattern is dead simple: one JSON object per run, appended to a JSONL file. JSONL just means "JSON lines": one full JSON object on each line, so the file can be read line by line without parsing anything fancy.
Here's the schema, complete, validated against the real field names from OpenTelemetry, Langfuse, and the OpenAI and Anthropic API docs. You can copy this today:
{
  "trace_id": "tr_8f14e45fceea167a5a36dedd4bea2543",
  "started_at": "2026-09-20T10:15:04.512Z",
  "ended_at": "2026-09-20T10:15:07.983Z",
  "status": "ok",
  "user_id": "u_123",
  "agent": {"name": "support-agent", "version": "1.4.2"},
  "total_usage": {"input_tokens": 2105, "output_tokens": 412, "cost_usd": 0.0183},
  "steps": [
    {
      "step": 1,
      "parent_id": null,
      "type": "llm_call",
      "name": "plan_reply",
      "model": "gpt-4o",
      "started_at": "2026-09-20T10:15:04.512Z",
      "ended_at": "2026-09-20T10:15:06.100Z",
      "input_messages": [{"role": "user", "content": "Where is my order #4312?"}],
      "output": {"text": "I'll check your order status.", "tool_calls": [{"id": "call_1", "name": "get_order_status", "args": {"order_id": "4312"}}]},
      "usage": {"prompt_tokens": 1840, "completion_tokens": 42, "total_tokens": 1882},
      "status": "ok"
    },
    {
      "step": 2,
      "parent_id": "call_1",
      "type": "tool_call",
      "name": "get_order_status",
      "started_at": "2026-09-20T10:15:06.101Z",
      "ended_at": "2026-09-20T10:15:06.640Z",
      "input": {"order_id": "4312"},
      "output": {"status": "shipped", "eta": "2026-09-22"},
      "error": null,
      "status": "ok"
    },
    {
      "step": 3,
      "parent_id": null,
      "type": "llm_call",
      "name": "final_reply",
      "model": "gpt-4o",
      "started_at": "2026-09-20T10:15:06.700Z",
      "ended_at": "2026-09-20T10:15:07.980Z",
      "input_messages": [{"role": "tool", "content": "{\"status\": \"shipped\", \"eta\": \"2026-09-22\"}"}],
      "output": {"text": "Your order #4312 shipped — ETA September 22."},
      "usage": {"prompt_tokens": 1903, "completion_tokens": 46, "total_tokens": 1949},
      "status": "ok"
    }
  ]
}
Walk it top to bottom, on the example run (a support agent answering "Where is my order #4312?"):
- Top of the record: the run.
trace_ididentifies this one run.started_atandended_atbracket it.statussays how it ended.user_idandagenttell you who was served by which version, which turns out to matter the moment you ship v1.4.3 and want to compare. total_usage: the whole receipt. Tokens in, tokens out, and the price in dollars for the whole run.steps: the story. Here it's three steps, exactly what happened:- Step 1,
llm_call: the model reads the question and decides to call a tool. Note itsusagereceipt: 1840 tokens in, 42 out. - Step 2,
tool_call: the tool runs. Itsparent_idiscall_1, the tool-call the model issued in step 1. That's the family tree. - Step 3,
llm_callagain: the model reads the tool's answer and writes the reply. Itsusage: 1903 in, 46 out.
- Step 1,
Every step carries its own receipt, and the run carries the total. The total_usage block is the whole run's bottom line in one place, so you never have to recount. The pattern is the point: step receipts for the details, the run total for the big picture.
And here's the quiet part worth saying out loud: this is a real trace. Not a toy. OpenTelemetry's own framing is that traces are "a collection of structured logs with context, correlation, hierarchy baked in." That's exactly what this file is: structured logs (JSON), with context (who, which agent, which version), correlation (one trace_id), and hierarchy (parent_id), baked in. The tree of a trace, flattened into a steps list you can read line by line.
To append one run to the file, ten lines of Python do it (illustrative, glue only):
import json

# append one run record to the trace log
# record = the dict you saw above; path = your .jsonl file
def save_trace(record, path="agent_runs.jsonl"):
    with open(path, "a", encoding="utf-8") as f:  # "a" = append-only
        f.write(json.dumps(record) + "\n")     # one JSON object, one line
That's the flight recorder. One function call per run, one line per run, and the 3am mystery box becomes a file you can open.
One more note on the cost lens this file gives you: the model field on every step is what makes the receipts meaningful, because the model's name sets the price per token. If you're still choosing which model your agent should run on, how to pick the right AI model for every task covers that decision. And if the receipts in your trace are getting big, static-first prompt caching: don't break the prefix shows how to shrink the tokens your traces will keep faithfully recording.
Evals score, observability watches
Think of a sports team. Before the game, they practice: they run known plays and score how well each one went. During the game, a camera rolls: it records whatever actually happens, good or bad. Practicing and filming are different jobs. Every serious team does both.
Evals are the practice field. Observability is the game film.
In plain words: evaluation scores your agent on known cases before you ship. Agent monitoring records what real runs do in production.
The official split, in LangSmith's own words, is:
- Offline evaluation: "test before you ship." You run your agent on a curated dataset of known cases during development, score the results, compare versions, catch regressions before real users ever see them.
- Online evaluation: "monitor in production." You evaluate real user interactions in real time, on live traffic, catching issues as they happen.
Langfuse frames the same two-sided coin from its side: its evaluation tools adapt whether you're testing in development or monitoring production performance, and evaluations can run on production traces.
And the two sides feed each other. This is the loop worth remembering: production failures become tomorrow's eval datasets. Both platforms state this loop explicitly. LangSmith: add real traces to a dataset so a failure you saw once becomes a test you run every time. Your five-minute trace log feeds it too. A saved bad run in your JSONL file is a test case waiting to happen: same inputs, expected output, one regression test, free.
Kid version of the whole section: score the rehearsal, record the show.
The platforms, honestly
Rented camera rooms. Picture a studio with editing suites, instant-replay screens, and a staff that never sleeps. Better cameras than your phone, no question. But you only need the studio when you have shows to review every night.
LLM tracing tools are worth it when you need retention at scale, dashboards, alerts, or a shared UI for the whole team. Until then, the JSONL file is enough.
Here's what the main platforms actually offer, features only, from each platform's own docs, as of September 2026 (this space moves fast; check the docs before you commit):
- OpenTelemetry is the plumbing standard, not a product. It gives you vendor-neutral APIs and SDKs for traces, metrics, and logs, plus a Collector that receives, processes, and exports telemetry to any backend. Its context propagation is the magic trick: spans from different services, even different machines, get assembled into one trace. OpenTelemetry describes itself as supported by more than 90 observability vendors. Treat that count as its own self-description, not an independent audit. For agent work, note that OpenTelemetry has semantic conventions for GenAI operations, moved as of recently into a dedicated GenAI semantic-conventions repository.
- Langfuse is open-source and self-hostable. It's built on OpenTelemetry, which it says reduces vendor lock-in. Its traces include all LLM and non-LLM calls (retrieval, embeddings, plain API calls), organized into sessions and users, with agents represented as graphs. You can capture data via its Python/JS SDKs, its listed 50-plus framework integrations, OpenTelemetry directly, or LLM gateways like LiteLLM (that's the one mention LiteLLM gets here). Beyond tracing: prompt versioning, a playground, experiments, evaluation via LLM-as-a-judge, user feedback, or manual labeling, and cost tracking with predefined model prices. The 50-plus integration count is Langfuse's own number.
- LangSmith describes traces as "the record of what your agents did in production," with filtering, export, sharing, and side-by-side compare. Around them: dashboards and alerts, automations and online evals, feedback collection via annotation queues and user feedback, an Engine that automatically detects recurring failures and root-causes them, and evaluation built on datasets and experiments. Cloud, hybrid, or self-hosted.
- OpenAI Agents SDK tracing is built in and on by default, if you're in that ecosystem. It creates automatic spans for generations, tool calls, guardrails, and handoffs, with a Traces dashboard to read them. Exporters are replaceable, so you can route traces to your own backend. And it has the sensitive-data off switch we met earlier.
So when is DIY enough? The decision rule is simpler than it sounds. The minimal loop data, the prompt, the tool calls, the responses, the usage, is all in your hands before any platform exists; that's exactly what the JSONL file proves. Reach for a platform when you need one of these:
- Retention and a UI at scale - a queryable record of thousands of runs, with screens your whole team can use
- Dashboards and alerts - charts that update themselves and ping you when something's off
- Online evals - automatic quality scoring on live traffic
- Datasets and replay - turning saved failures into regression tests with one click
- Prompt versioning - managing prompt changes like code changes
- Multi-framework auto-instrumentation - tracing across frameworks without writing glue per tool
- Team collaboration - annotations, shared views, assignment of failures to owners
- Vendor-neutral export - keeping your data portable, which is OpenTelemetry's whole point
Until you need one of those, the JSONL file is honest, portable, and yours. One thing observability can't do is make an agent trustworthy on its own. If you're thinking about putting agents in production for real, the real risks of AI agents nobody talks about is the companion read: seeing what your agent did is step one of trusting it at all.
Seeing is trusting. Back to the 3am scene, one last time. Same moment, same weird run. But now you open the trace log, point at step 2, and say exactly what the agent did, why it did it, and what it cost. The mystery box becomes a window.
The whole arc in one line, kid-readable: record every run (the flight recorder), read it like a detective (the case file), and keep getting better (the game film feeding practice).
One honest final note. Observability won't make your agent good. It makes your agent legible: readable, explainable, comparable. And legible is the only thing you can improve.
Observability FAQs
What's the difference between a trace and a span? A span is one unit of work: a single step with a name, a start, an end, and a parent. A trace is the whole run: all the spans that share one trace_id, from arrival to final answer. LangSmith uses the word "run" where OpenTelemetry uses "span", and its docs say so explicitly, but the shape is identical.
Is logging the same as tracing? No. Plain logs are scattered notes: useful, but each line stands alone. A trace is the same kind of notes with context, correlation, and hierarchy baked in, OpenTelemetry's own framing: every line knows which run it belongs to (trace_id), which step caused it (parent_id), and when it started and ended. The story organizes itself.
Do OpenAI and Anthropic responses tell me how many tokens a run used?
Yes, both hand you a receipt in a usage object. OpenAI: prompt_tokens, completion_tokens, total_tokens. Anthropic: input_tokens, output_tokens. One caveat with streaming: the numbers arrive only in the final chunk, and only if you asked for them (OpenAI needs stream_options: {"include_usage": true}). Interrupt the stream early and you may never see the receipt.
How do I spot a runaway retry loop in a trace?
Look for the same tool span repeating with the same arguments under one trace_id. Steps 12, 13, 14, and 15 all named get_order_status with the same input: that's your loop. LangSmith enforces a hard ceiling on this failure mode: it rejects runs beyond 25,000 in a single trace. Your DIY log has no ceiling, so you spot loops by eye.
Does tracing expose sensitive prompts and tool outputs?
It can. Default tracing records full inputs and outputs, and the OpenAI Agents SDK warns directly that these may contain sensitive data. It offers an off switch (trace_include_sensitive_data=False). Decide your redaction rules before you turn recording on, because once a secret is in a log file, the log file has a secret in it.