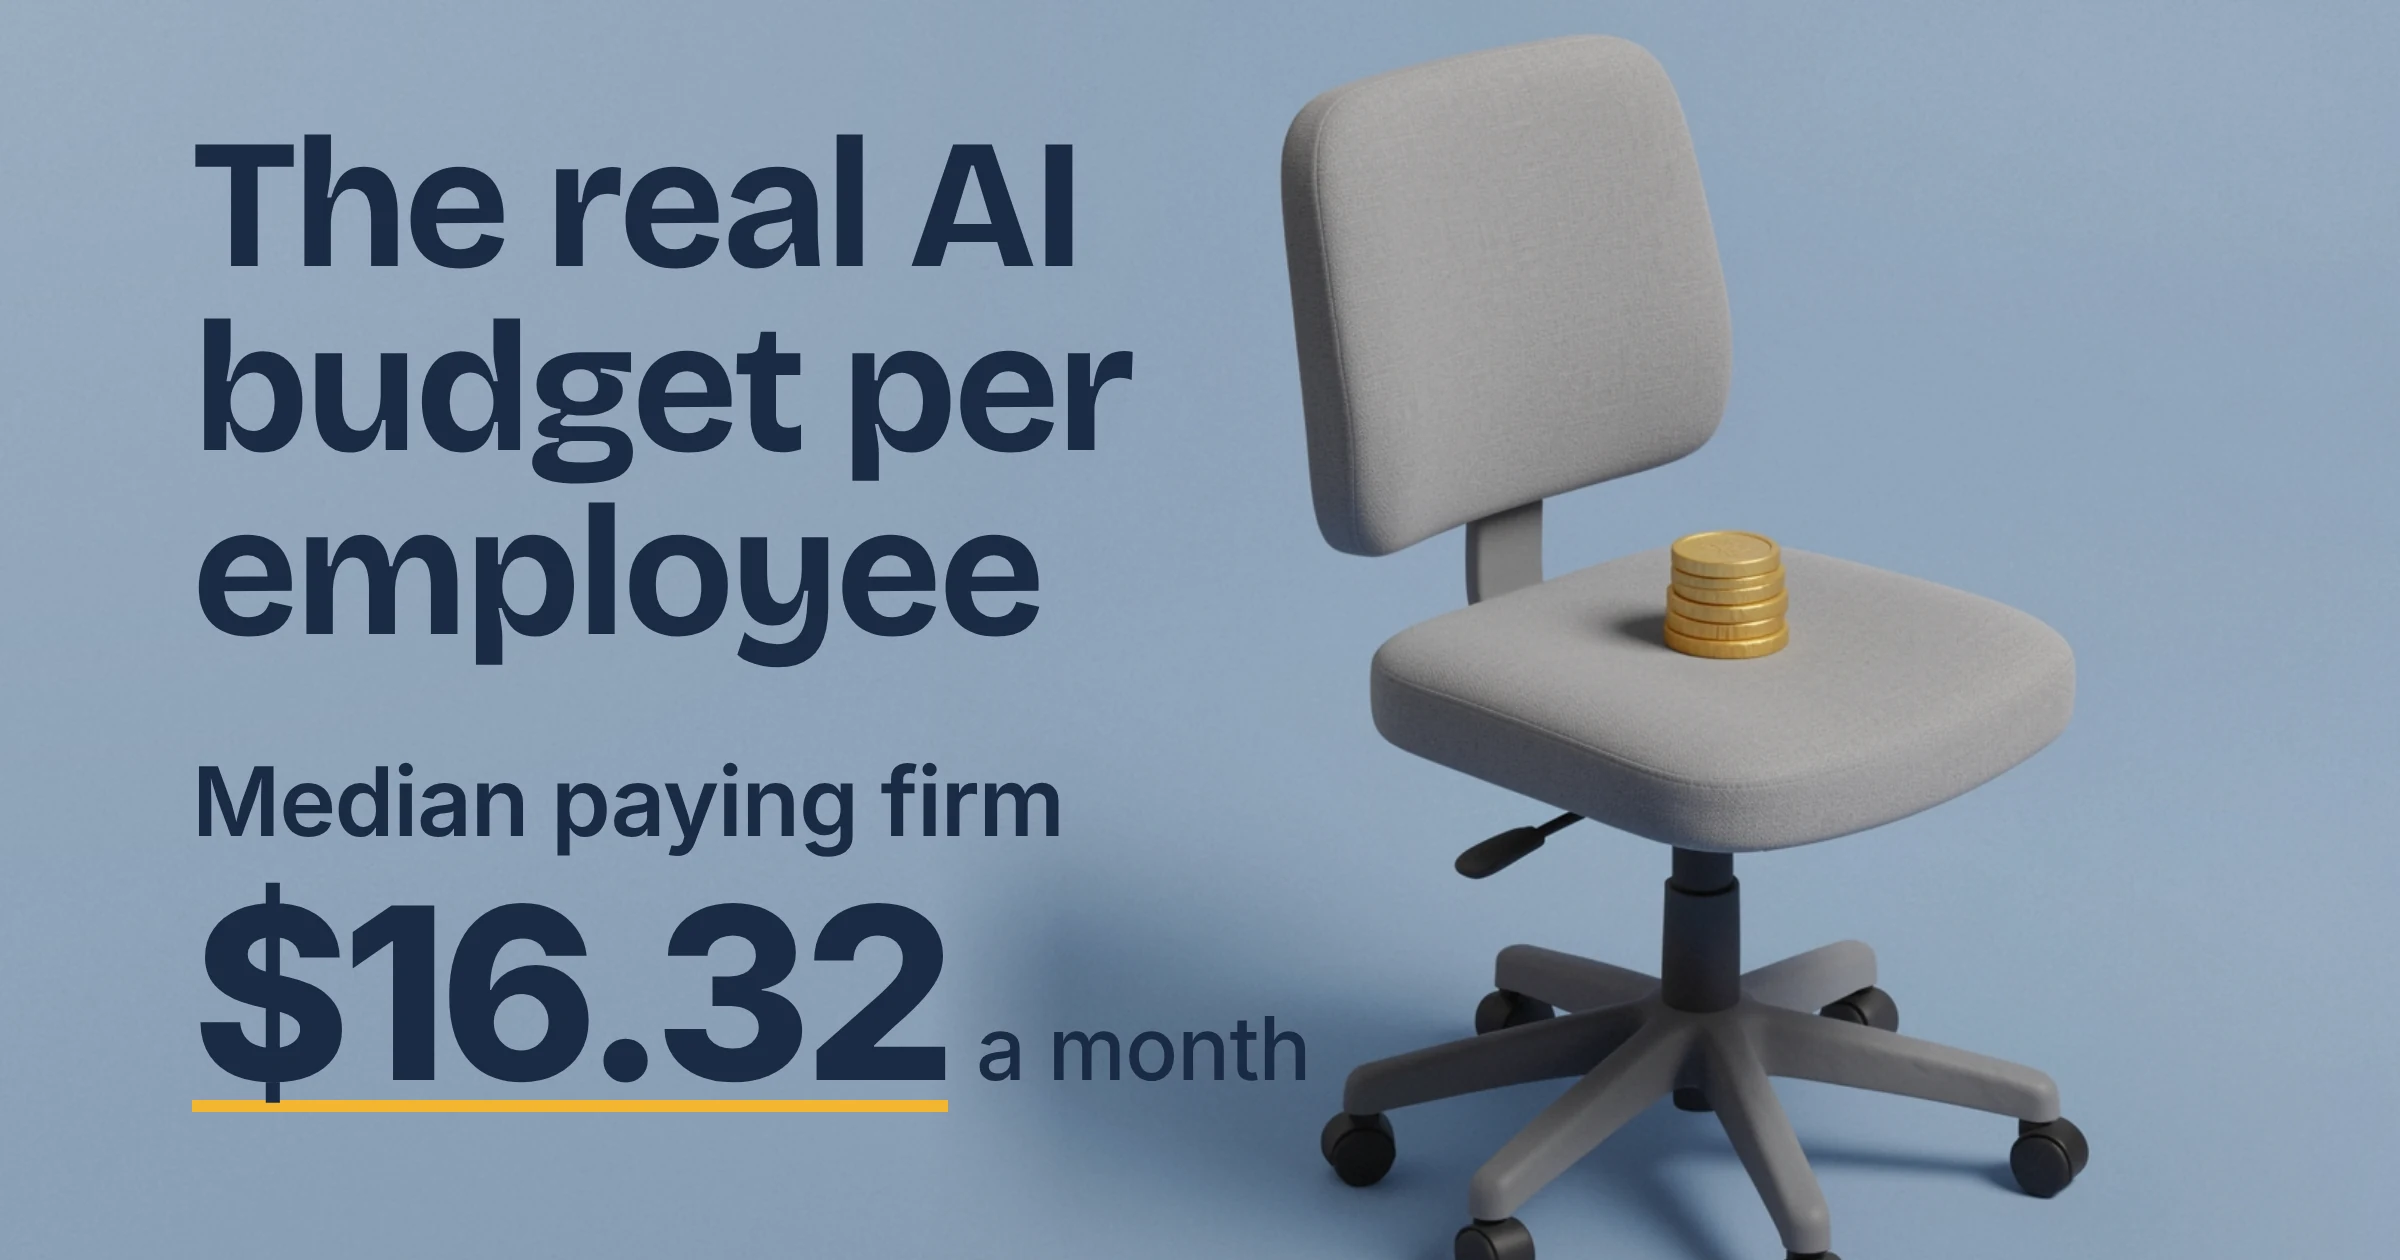
As of October 2026, the median US business on Ramp that pays for AI spends $16.32 per employee per month, according to the Ramp AI Index. That's a useful reference point for what firms that pay for AI spend per employee. If your own number is in that neighbourhood, you're right in line with the typical paying firm.
The spread above that is huge. The top 10% of paying firms spend a median $800.84, the top 1% spend $10,199.20, and only just over half (56.8%) of US businesses on Ramp paid for AI at all.
How much do businesses spend on AI per employee each month?
As of October 2026, the median US firm on Ramp paying for AI spends $16.32 per employee per month, up $0.93 from September, per the Ramp AI Index. "Median" means the firm in the middle of the line, so a handful of huge spenders can't drag it up the way they would drag up an average.
Ramp reports three reference points, and the gap between them is the whole story. All three cover only firms that paid for AI. For the top 10% and top 1%, the figure is the median within that group.
| Group (US firms paying for AI on Ramp) | Spend per employee per month (Oct 2026) | Compared with the median | Best used as |
|---|---|---|---|
| Median firm | $16.32 | Baseline | Your first benchmark for an everyday-work team |
| Top 10% of firms | $800.84 | About 49x | An upper-end check for AI-heavy teams |
| Top 1% of firms | $10,199.20 | About 625x | Context, not a target |
What those tiers cost a 10-person team
Multiply each figure by headcount and the gap stops being abstract. This is simple arithmetic on Ramp's published numbers, not a quote for any tool.
| Tier | Per employee per month | 10-person team per month | 10-person team per year |
|---|---|---|---|
| Median | $16.32 | $163.20 | $1,958.40 |
| Top 10% | $800.84 | $8,008.40 | $96,100.80 |
| Top 1% | $10,199.20 | $101,992 | $1,223,904 |
Real bills rarely split this neatly. An agency might buy paid seats only for its writers and leave the bookkeeper on free tools, and API charges (paying per use when your software talks to an AI model directly) can swing from month to month. Treat the per-employee figure as an envelope, not a price list.
What percentage of businesses pay for AI in 2026?
As of October 2026, 56.8% of US businesses on Ramp paid for AI, up 1.0 percentage point from September and 13.3 points from a year earlier, according to the Ramp AI Index. Put simply, a little over half of the firms in Ramp's data had at least one AI charge that month.
Ramp counts a business as an adopter if it paid for AI models, subscriptions, tokens or APIs in that month. Tokens are the small chunks of text AI providers bill by. Ramp spots these payments in corporate card, invoice and ACH (bank transfer) transactions, using merchant names and line items.
So a free ChatGPT account doesn't count, and neither does a manager quietly paying for Claude on a personal card.
Spending kept climbing too: total AI spending reached a new peak in October, rising 1.65% from September, per Ramp's November 2026 index letter.
Do small businesses adopt AI less than big companies?
Only the very smallest do, according to the Ramp AI Index. As of October 2026, micro-SMBs had the lowest adoption on Ramp at 51.2%, but mid-market firms (66.7%) and SMBs (63.2%) both beat enterprises (59.0%).
| Size band (Ramp) | Paying for AI, Oct 2026 | Change vs September | Read it as |
|---|---|---|---|
| Mid-market | 66.7% | +1.1 pts | The most likely band to pay for AI |
| SMB | 63.2% | +0.8 pts | Ahead of enterprise |
| Enterprise | 59.0% | -0.2 pts | The one band here that slipped |
| Micro-SMB | 51.2% | +1.2 pts | Lowest, but the biggest monthly gain in this table |
Size alone doesn't decide who pays for AI, and big companies aren't automatically ahead. Headcount ranges for each band aren't part of the figures used here, so treat the labels as rough guides when you compare yourself.
Is your industry ahead or behind on AI adoption?
As of October 2026, Information (80.1%), Finance and Insurance (74.3%) and Professional, Scientific and Technical Services (70.8%) sat well above the 56.8% overall rate on Ramp, while Accommodation and Food (35.0%) was near the bottom of the sector list. The table shows a selection of the sectors Ramp tracks.
| Sector | Paying for AI, Oct 2026 | Change vs September | Versus the 56.8% overall rate |
|---|---|---|---|
| Information | 80.1% | +0.2 pts | Well ahead |
| Finance and Insurance | 74.3% | +0.3 pts | Well ahead |
| Professional, Scientific and Technical Services | 70.8% | +0.5 pts | Ahead |
| Retail Trade | 49.9% | 0.0 pts | Behind |
| Construction | 45.0% | +1.9 pts | Behind, catching up |
| Healthcare | 43.7% | +1.2 pts | Behind, catching up |
| Accommodation and Food | 35.0% | +2.0 pts | Furthest behind, catching up |
Look at the last column. Among the sectors in this table, the three with the lowest adoption posted the three biggest monthly gains, while the leaders barely moved. For this month at least, the gap narrowed.
What that means for you: if you run a restaurant, clinic or building firm and don't pay for AI yet, most of your sector doesn't either, on Ramp's numbers. You're not losing a race, but your peers are lacing up.
Which AI vendors are businesses actually paying?
As of October 2026, Anthropic (the maker of Claude) was paid by 44.8% of US businesses on Ramp and OpenAI (the maker of ChatGPT) by 40.6%, according to the Ramp AI Index. Anthropic grew 1.1 points over the month, while OpenAI was essentially flat at -0.1 points.
Those two shares add up to more than the 56.8% of businesses paying for any AI, so plenty of firms clearly pay both. If your team drafts emails in ChatGPT and summarizes reports in Claude, that's a common setup, not a mess.
Which teams in a company spend the most on AI?
As of October 2026, engineering teams drove 72% of the AI spend Ramp could tie to a department, down from highs earlier in the summer, according to Ramp's November 2026 letter. Department tracking is new in this release, so there isn't a long history yet.
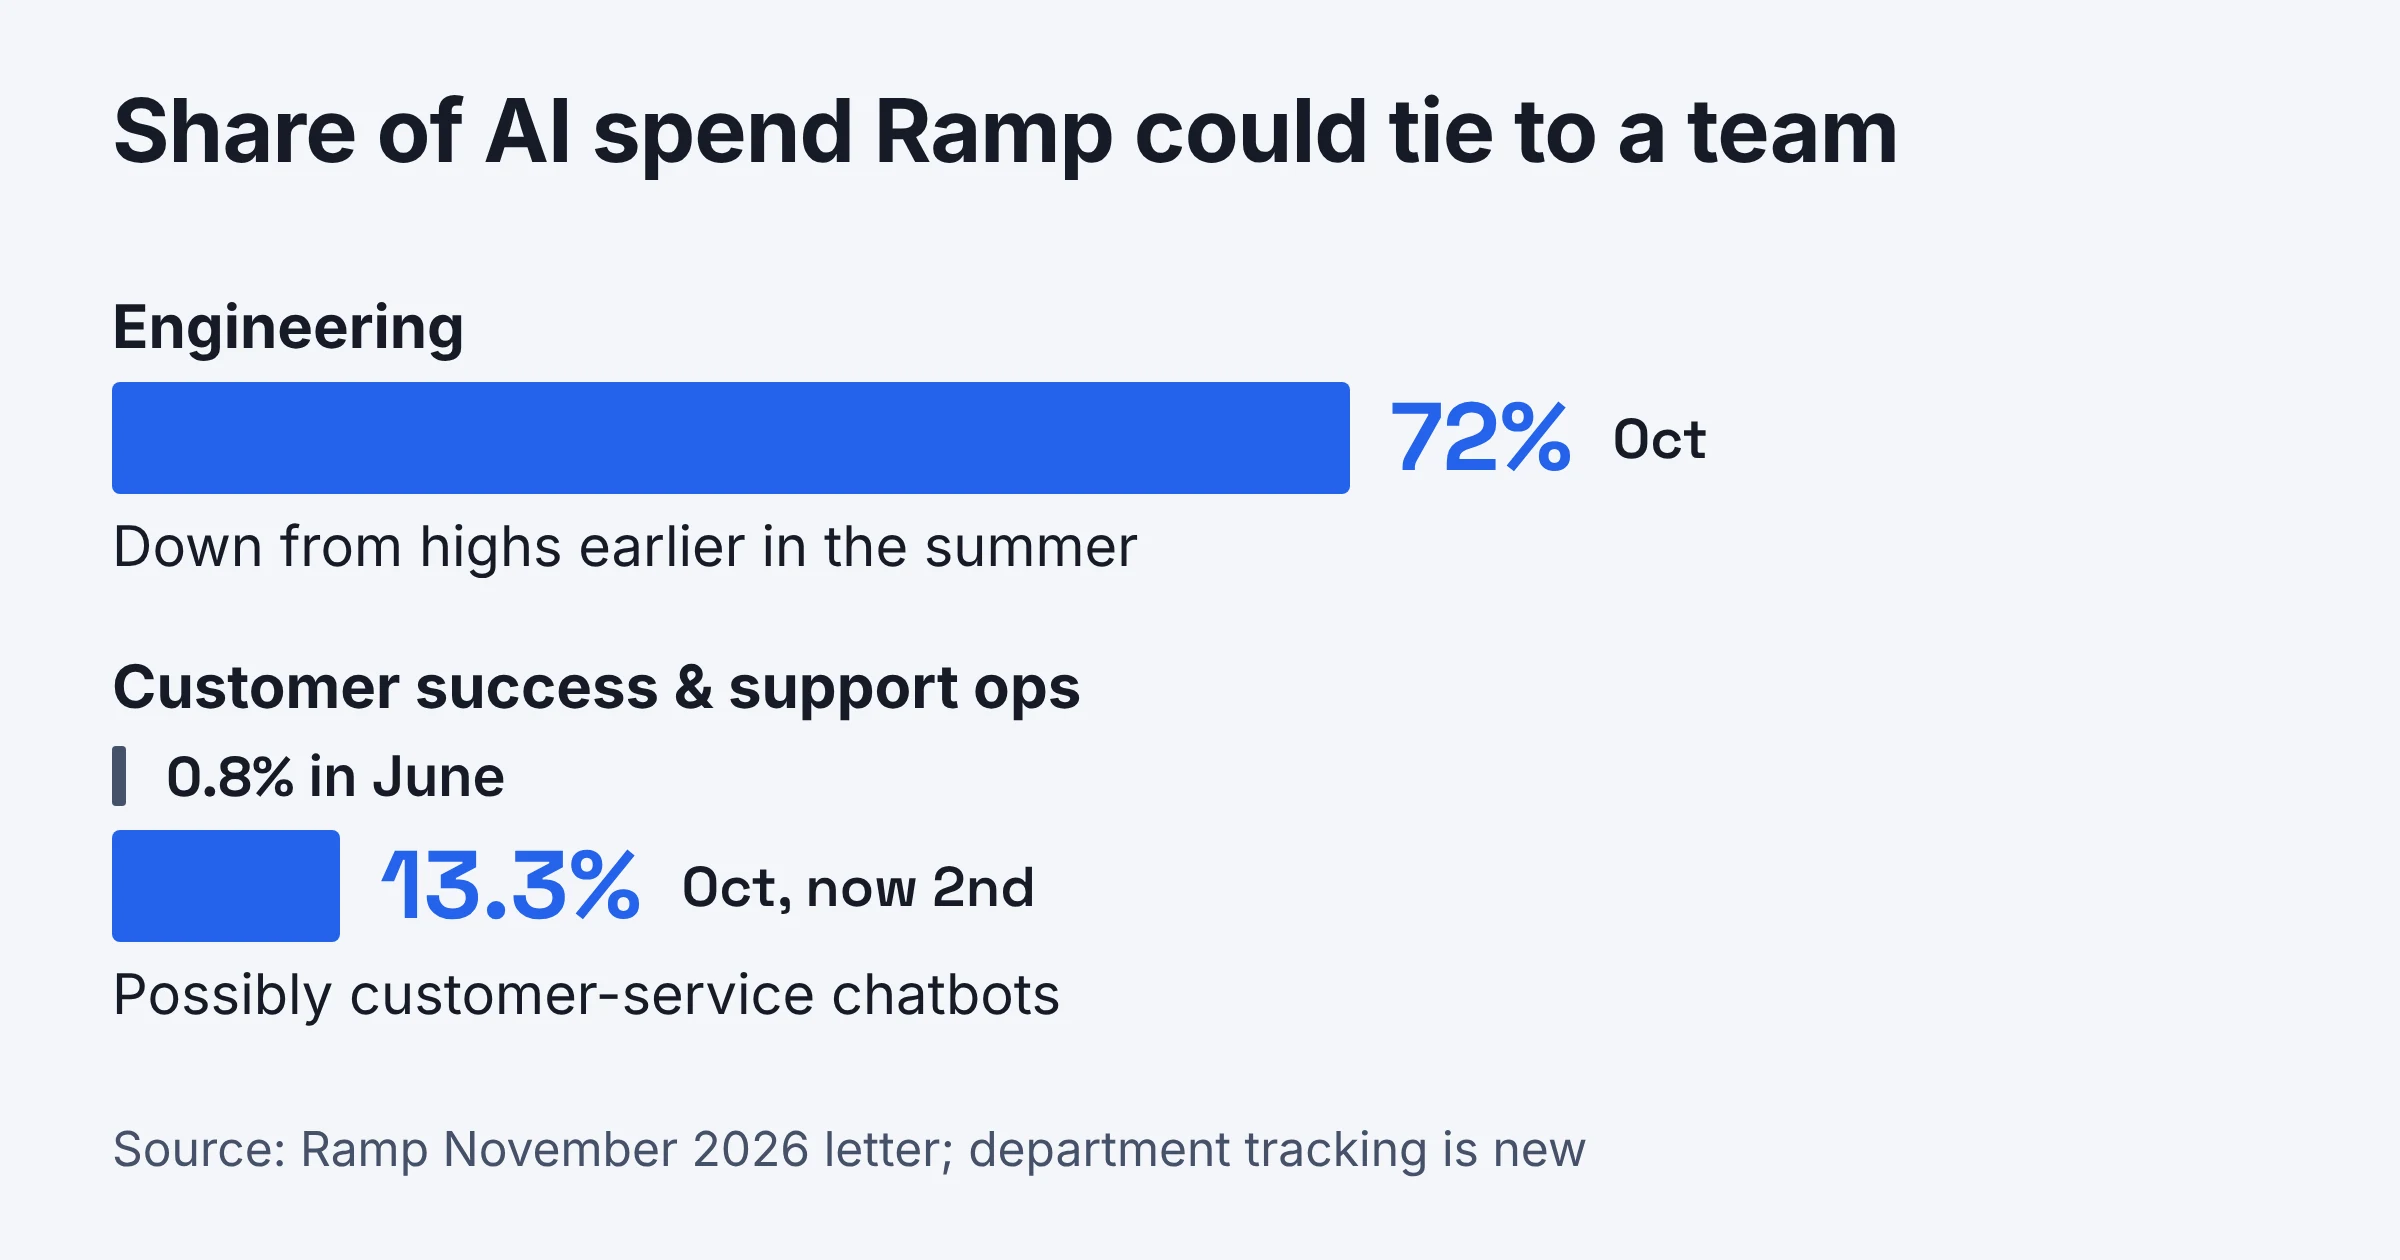
The fast mover is support. Customer success and support operations drove 13.3% of classified spend (spend Ramp could assign to a team), up from 0.8% in June, and Ramp suggests that's possibly customer-service chatbots.
Ramp expects fast, cost-effective models to see more demand as AI spreads beyond engineering. If a support bot is on your list, this guide to AI model routers and their real cost math shows how teams send simple jobs to cheaper models.
Why is the median so much lower than the top 1%?
AI spend is highly concentrated: Ramp's November 2026 letter says 1% of businesses drive 80% of the revenue going to OpenAI and Anthropic, and that group is largely VC-backed tech, finance and technical services firms. A thin layer of very heavy spenders sits on top, and most paying firms spend modestly.
Picture a town's grocery bills where a few restaurants buy wholesale by the truckload. The average bill gets silly, while the median tells you what a normal household spends. That's why this post leans on medians.
Ramp also says AI spend is "failing to proliferate outside of those sectors," and that growth in the median and top 10% groups is "relatively sluggish." So don't expect the gap to close quickly.
Falling prices are part of the picture. Ramp reports the average price per million tokens fell 21% over the month, and token volume is growing faster than spend, so the same budget buys more AI work. For why cheaper prices don't always mean smaller bills, see why AI inference bills can still rise.
Can you trust the Ramp AI Index numbers?
Trust the Ramp AI Index as a solid trend signal, not a census of US business. It's built from payment data of more than 85,000 US companies on Ramp, and The Decoder notes that the sample "isn't necessarily representative" of US businesses overall.
What the data can't tell you
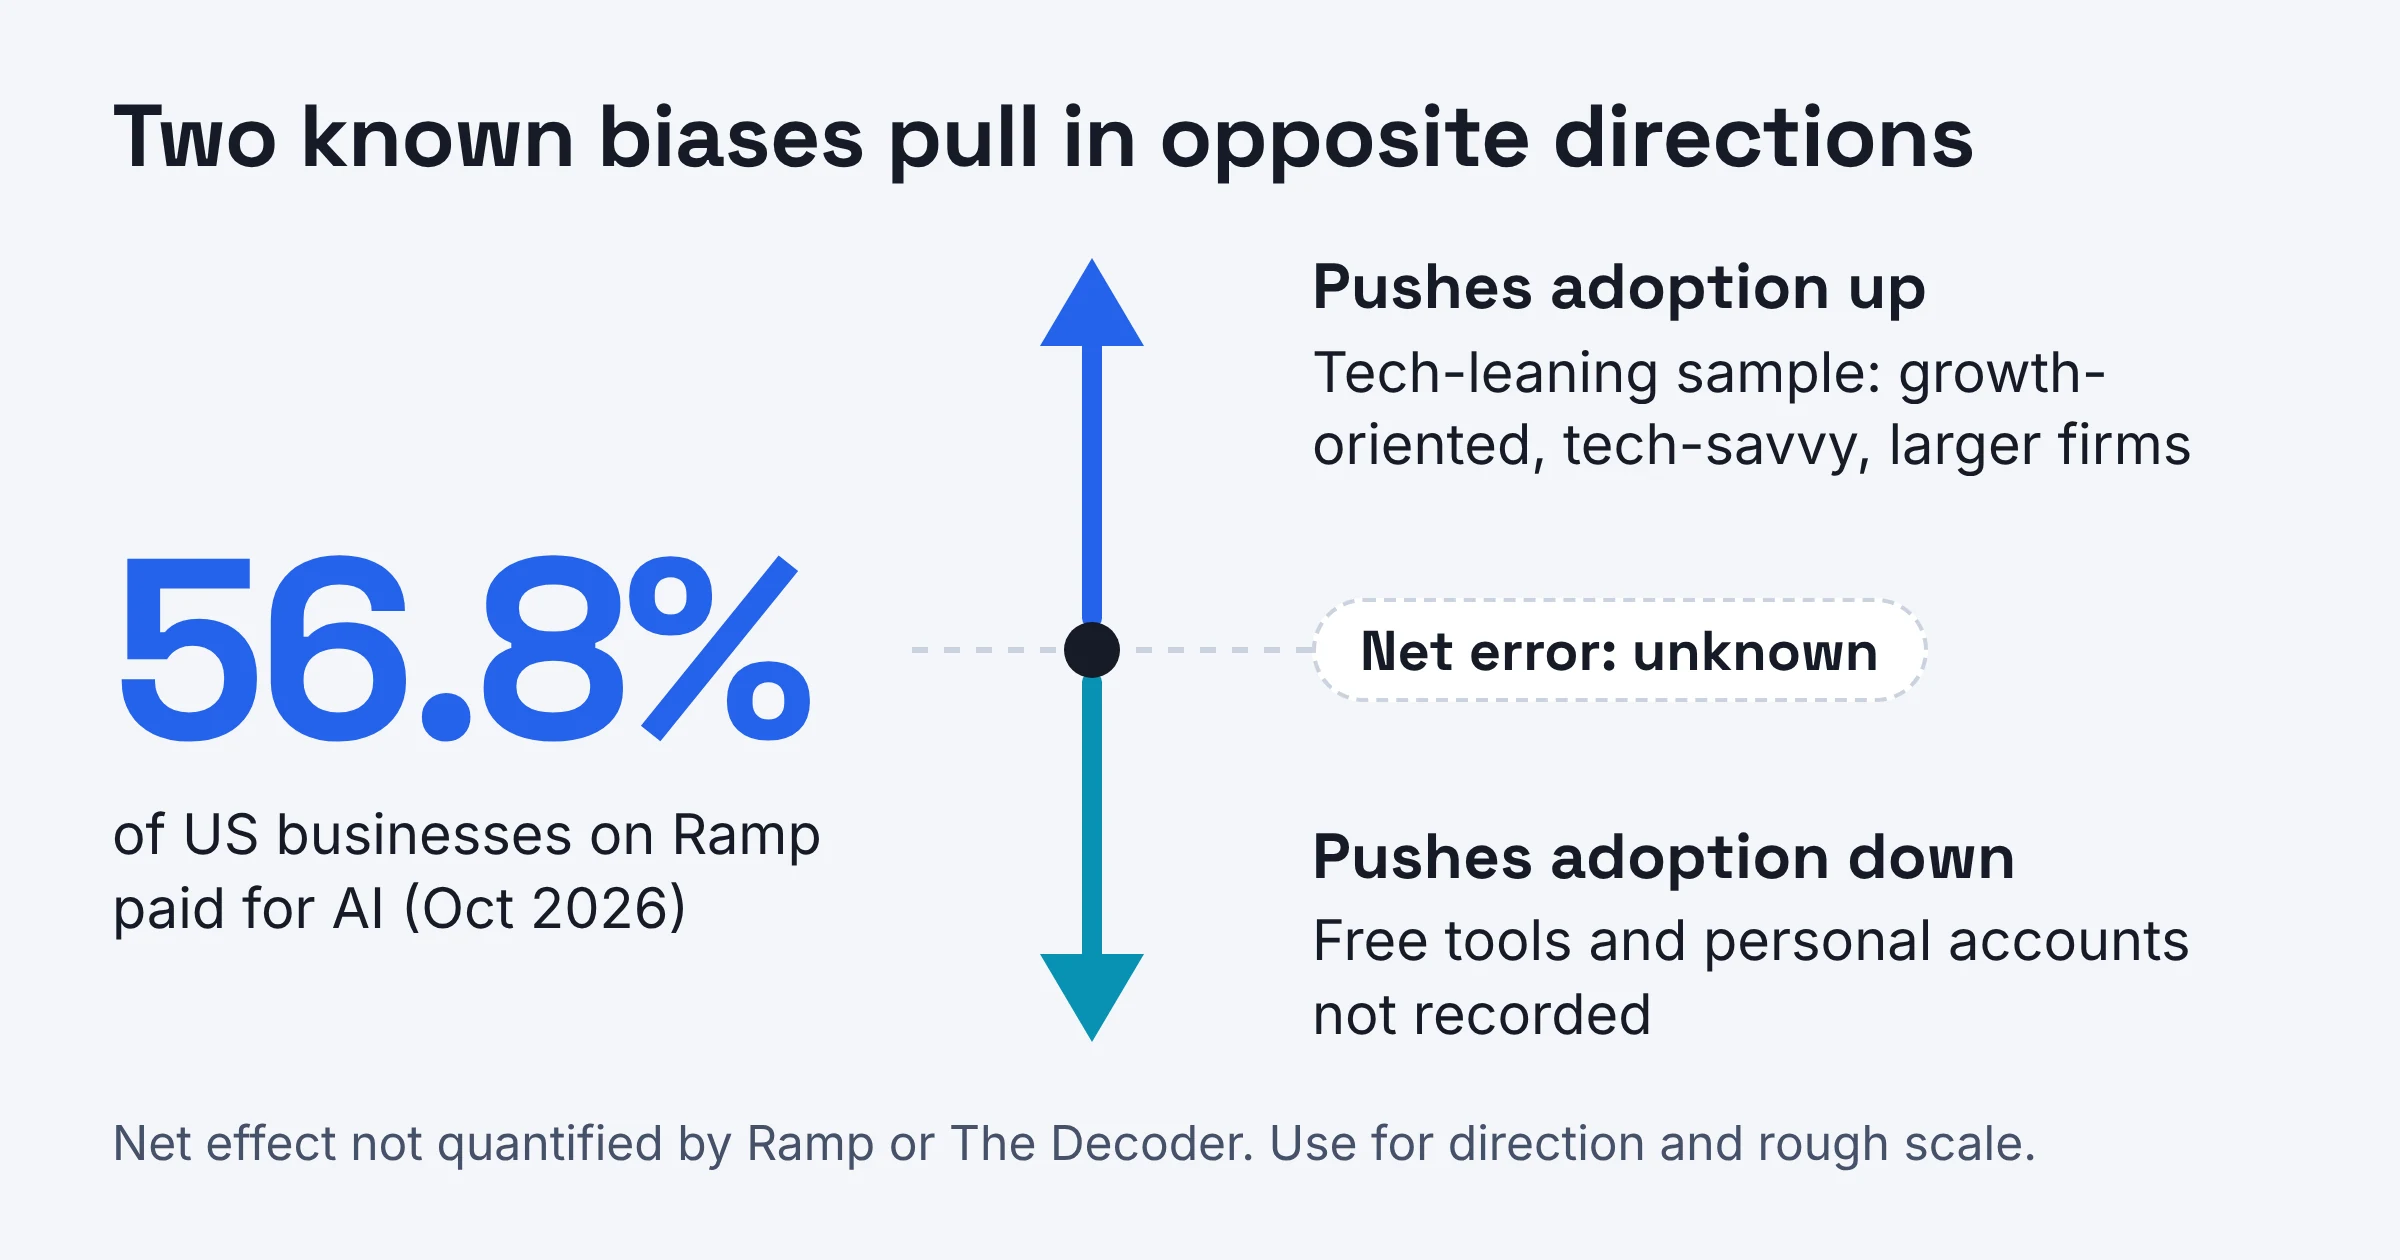
- Businesses outside Ramp. Ramp's customers skew growth-oriented, tech-savvy and larger than US businesses overall, so The Decoder says adoption is likely overstated.
- Free tools. No payment means no record. Ramp itself says its results likely underestimate adoption and spend for this reason.
- Personal accounts. Employees who pay for AI on their own cards to do work tasks are invisible here.
- Firms that pay nothing. Spend per employee only covers firms paying for AI. Count every business, including those spending nothing, and the typical figure would be lower than $16.32.
- Spend by size or sector. The figures here give adoption by size and sector, but not per-employee spend for each, so this data can't tell you what a mid-sized law firm spends.
- A meaningful average. With spending this concentrated at the top, any simple average would sit far above what most firms pay.
- Whether it's worth it. Payment data shows what firms spend, not what they get back.
The two biases the sources flag pull in opposite directions: a tech-leaning sample pushes adoption up, while free tools and personal accounts push it down. Neither source puts a number on the net effect, so use the index for direction and rough scale.
How much should you budget for AI per employee?
Ramp doesn't publish a recommended budget, so treat $16.32 per employee per month (the October 2026 median among paying firms) as your reference point and $800.84 (the top 10% median) as your "that's a lot" line. Your actual number should come from the jobs you want AI to do, not from matching anyone.
Pick your reference point
| If your team... | Use this as your reference | Why |
|---|---|---|
| Uses AI for email, writing, research and admin | The median: $16.32 per employee per month | It's what the typical paying firm spends |
| Builds products on AI APIs or runs a support chatbot | Between the median and the top 10% ($800.84) | Engineering drives most classified spend, and support's share jumped from 0.8% in June to 13.3% |
| Is a VC-backed tech or finance firm built around AI | The top 10% and above | That's the profile Ramp links to the heaviest spenders |
| Works in a sector below the 56.8% overall rate and pays for nothing yet | Start near the median, for the people who'd use it most | Plenty of your peers don't pay for AI yet, so there's no catch-up race |
A simple sanity rule: if your per-employee figure lands above the top 10% line and you aren't an AI-heavy company, make sure every paid seat and API key is tied to a real job.
Do this next
- Find your real spend. Pull AI charges from company cards and invoices, then ask staff which AI tools they pay for personally. Ramp's data misses personal accounts, and your books probably do too.
- Divide by headcount. Compare the result with $16.32 and $800.84. Sitting below the median isn't a problem if the work is getting done.
- Fund one job at a time. Pick a single task, such as drafting customer replies or summarizing invoices, give it a short trial, and keep paying only if it saves time you can see. For what real tools cost across a typical week of admin work, see AI tools for small business, with real costs.
Spend and adoption figures were checked on Ramp's AI Index pages in November 2026; they change every month.